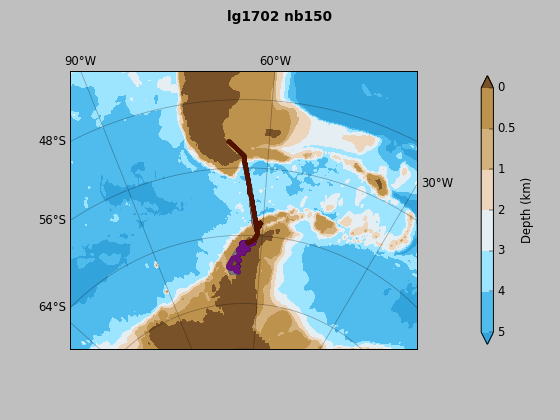
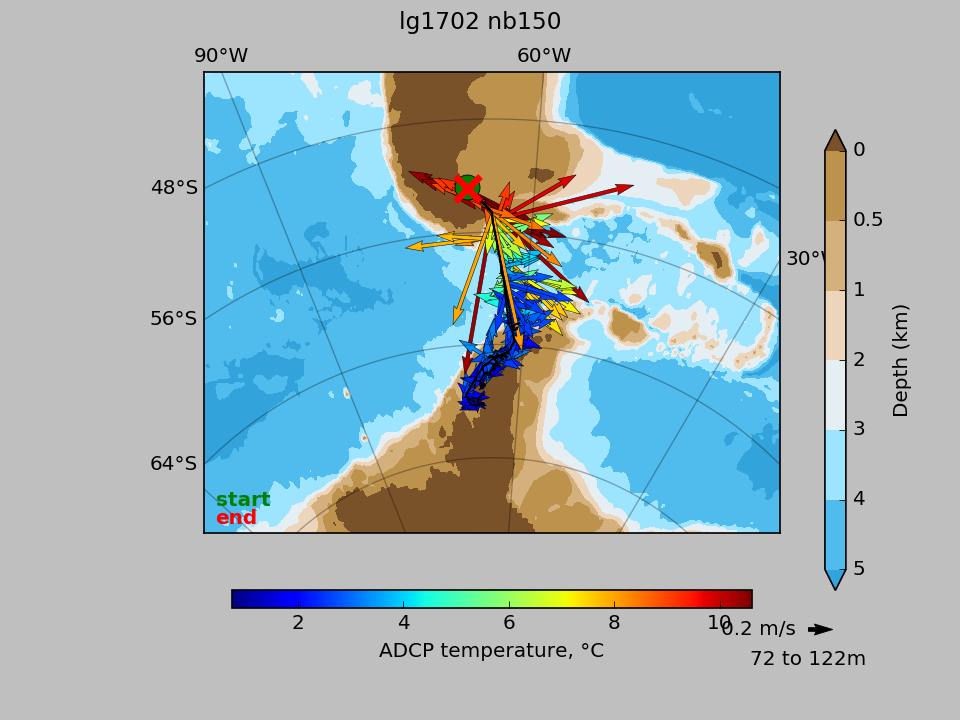
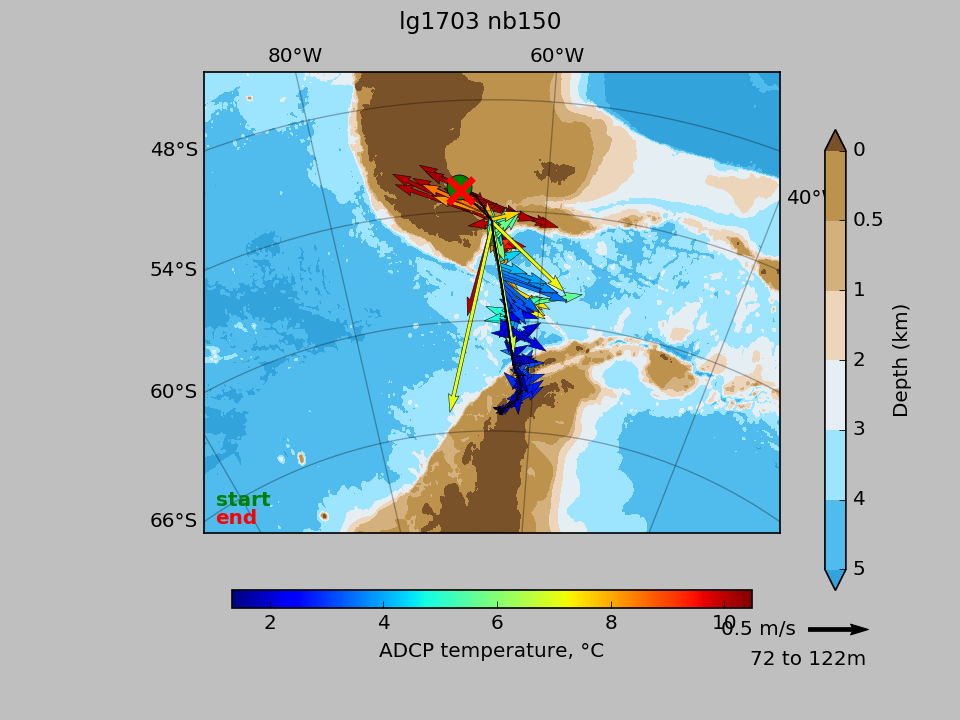
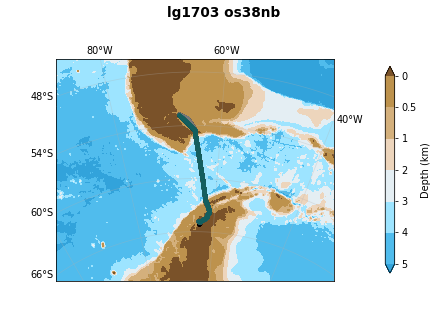
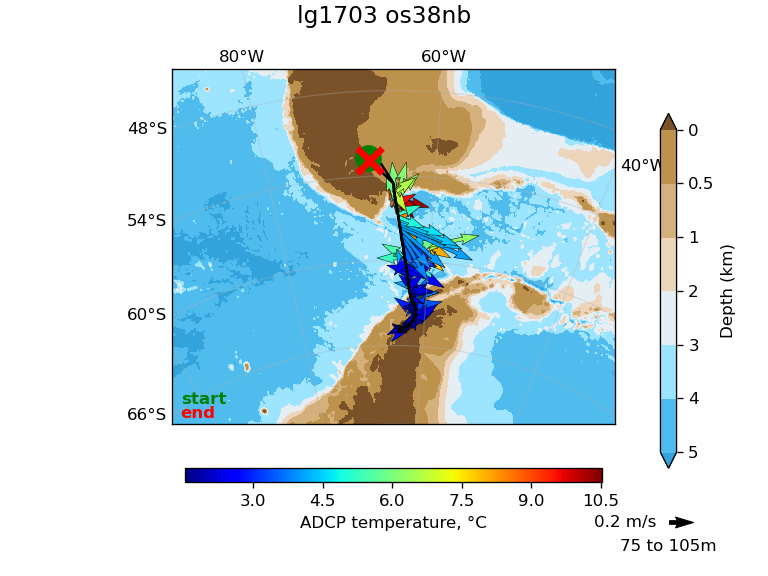
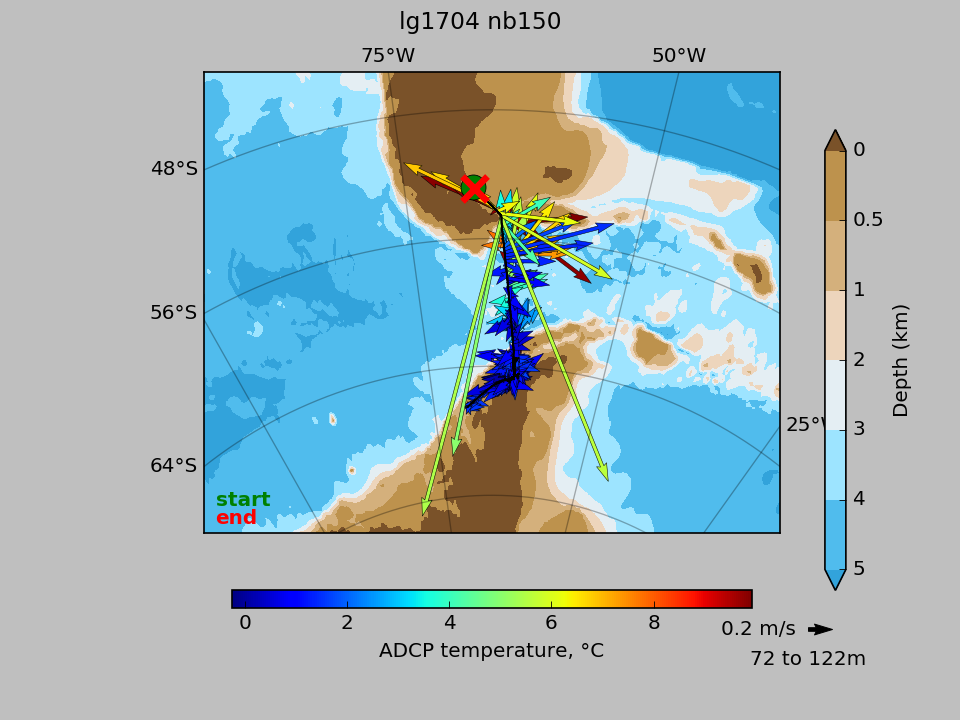
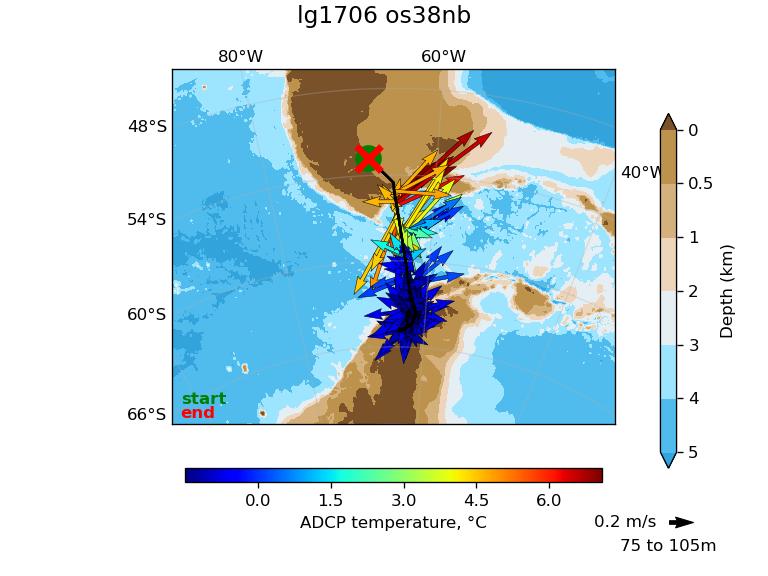
Long-Term Ecological Research (LTER) on the Antarctic Marine Ecosystem : To document/understand the phenology and variability in sea ice dynamics, primary production, zooplankton ecology, Adelie penguin demography, microbial and biogeochemical processes in the Antarctic marine ecosystem.
Jan 2017 - Feb 2017
examine data
or download
png of map or (back to top)
or link to JASADCP
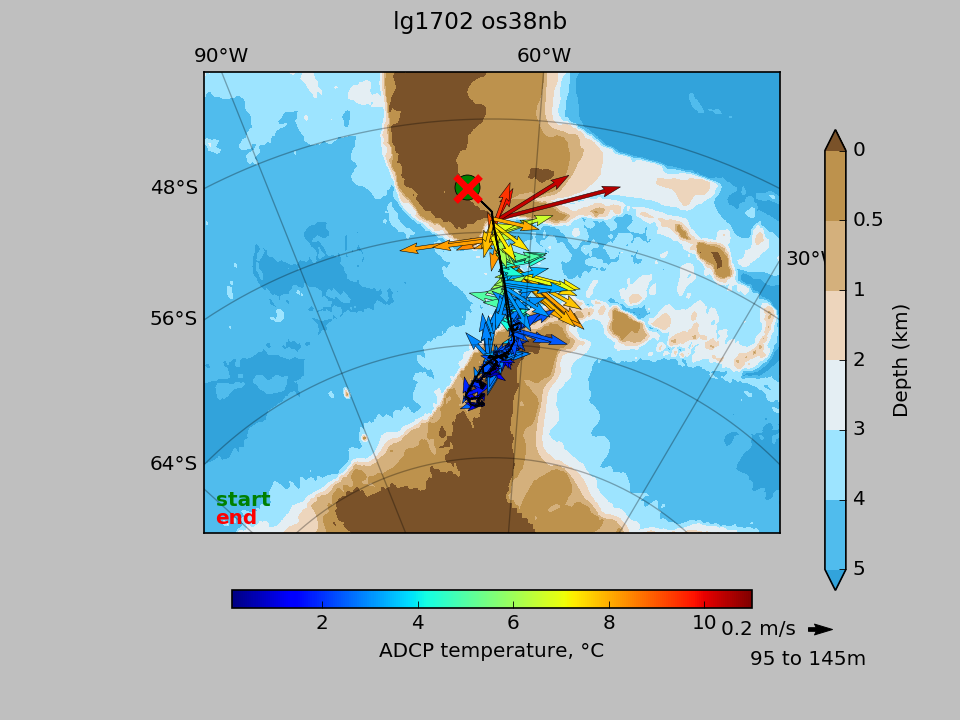
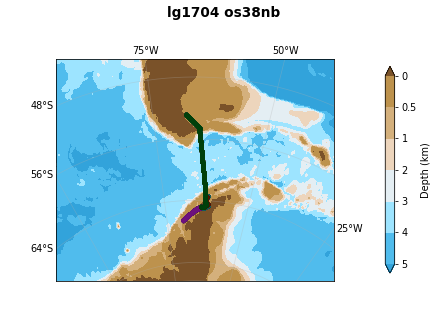
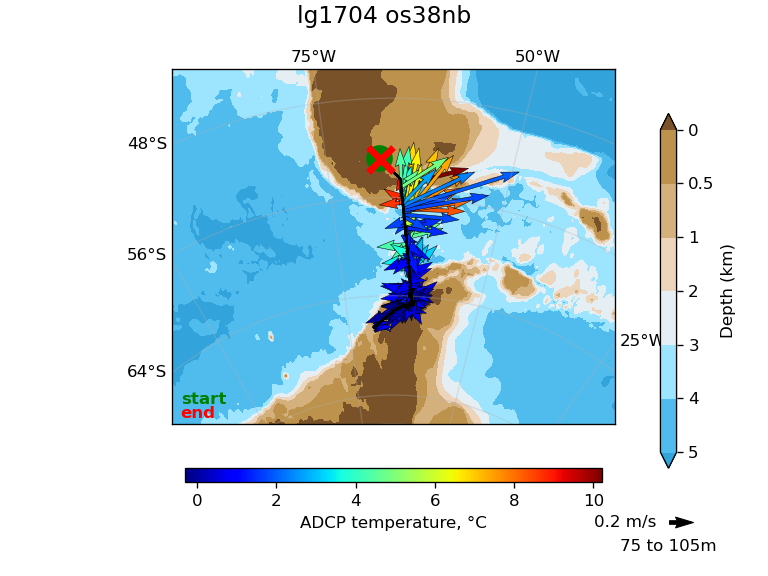
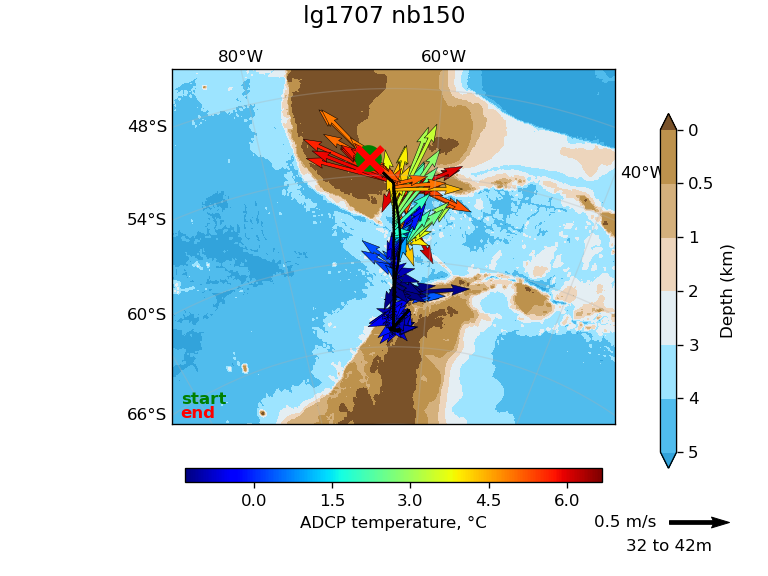
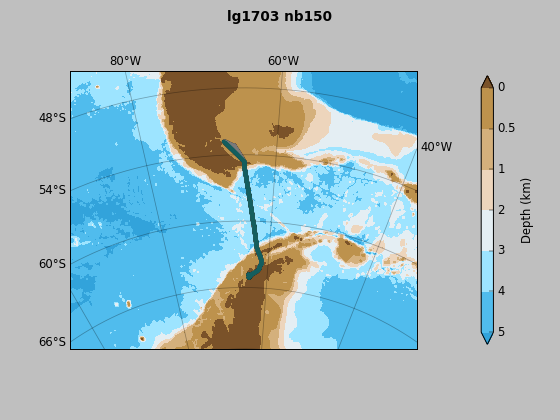
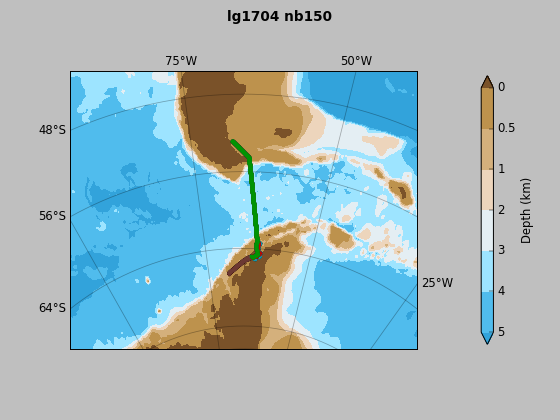
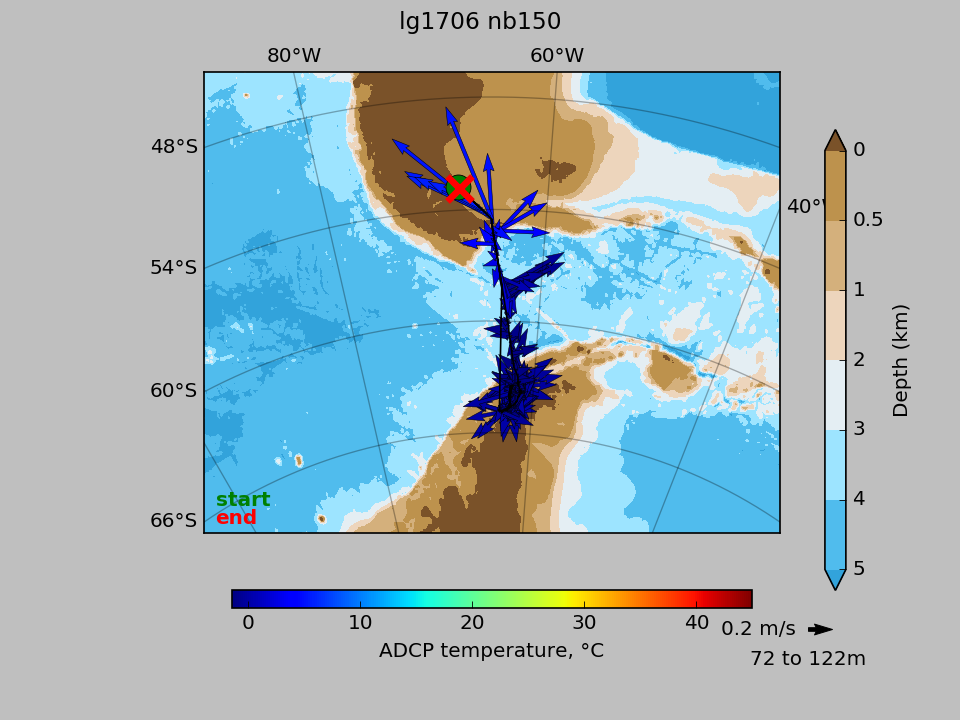
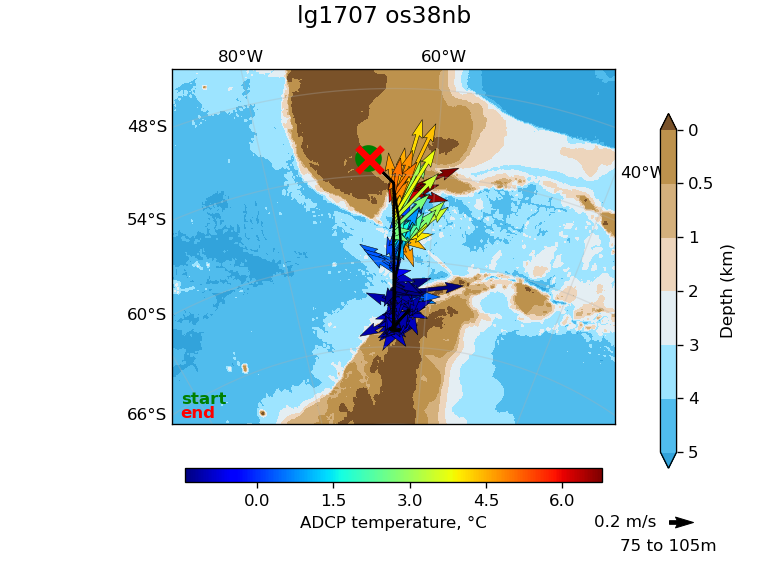
This multi-platform field study will investigate the impact of coastal physical processes, e.g., tides, currents, upwelling events, and sea ice, on Adelie penguin foraging ecology in the vicinity of Palmer Deep off Anvers Island, WAP.
Feb 2017 - Mar 2017
examine data
or download
png of map or (back to top)
or link to JASADCP
Palmer Station Turnover
This project seeks to enhance the capability to observe the ocean's transport and storage of heat and carbon dioxide and the response of these processes to climate change with autonomous technology be deploying a Liquid Robotics Wave Glider SV3 fro five months to measure surface wave, temperature and salinity, upper-oceans current, barometric pressure, and winds.
Mar 2017 - Apr 2017
examine data
or download
png of map or (back to top)
or link to JASADCP
To understand the molecular and physiological capacities of Antarctic notothenioid fishes to acclimatize and/or adapt to rapid oceanic warming
Apr 2017 - May 2017
examine data
or download
png of map or (back to top)
or link to JASADCP
To understand the molecular and physiological capacities of Antarctic notothenioid fishes to acclimatize and/or adapt to rapid oceanic warming
Apr 2017 - May 2017
examine data
or download
png of map or (back to top)
or link to JASADCP

To understand the molecular and physiological capacities of Antarctic notothenioid fishes to acclimatize and/or adapt to rapid oceanic warming
May 2017 - June 2017
examine data
or download
png of map or (back to top)
or link to JASADCP

To understand the molecular and physiological capacities of Antarctic notothenioid fishes to acclimatize and/or adapt to rapid oceanic warming
May 2017 - June 2017
examine data
or download
png of map or (back to top)
or link to JASADCP

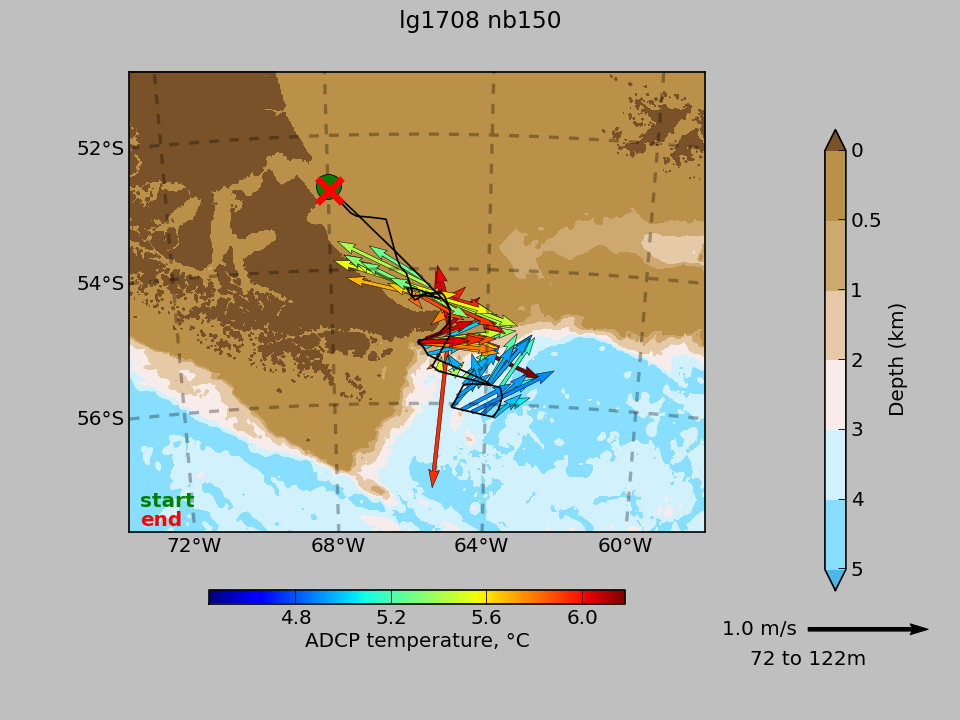
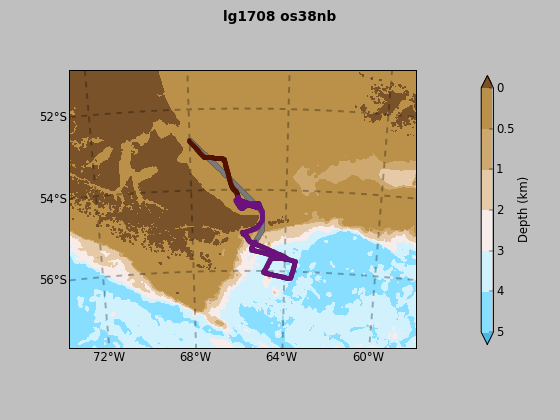
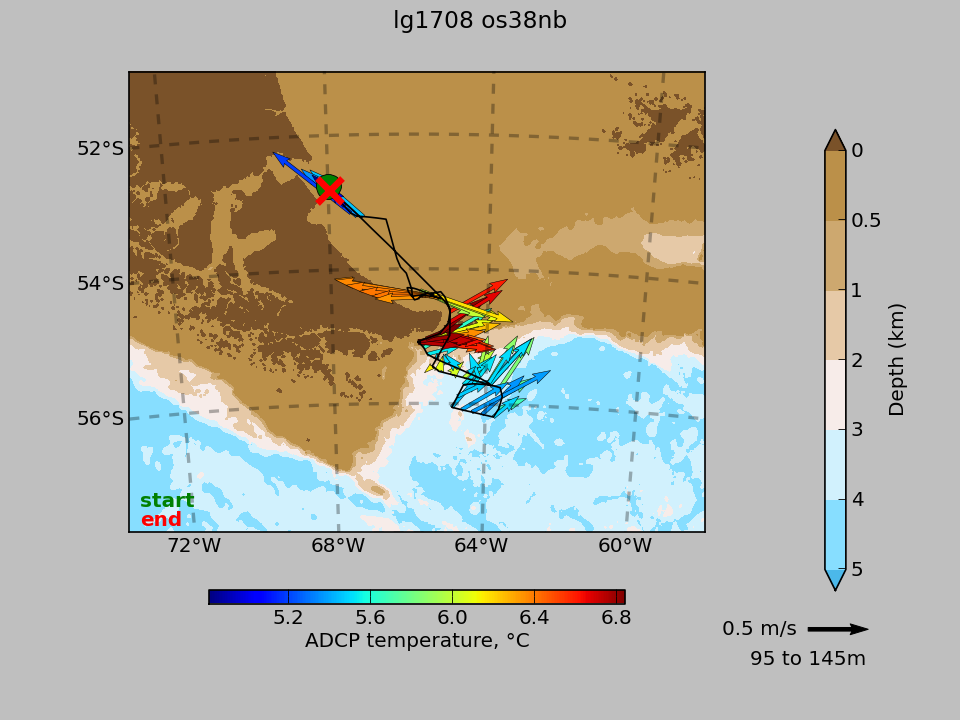
To understand the molecular and physiological capacities of Antarctic notothenioid fishes to acclimatize and/or adapt to rapid oceanic warming
Aug 2017 - Sep 2017
examine data
or download
png of map or (back to top)
or link to JASADCP
To understand the molecular and physiological capacities of Antarctic notothenioid fishes to acclimatize and/or adapt to rapid oceanic warming
Aug 2017 - Sep 2017
examine data
or download
png of map or (back to top)
or link to JASADCP

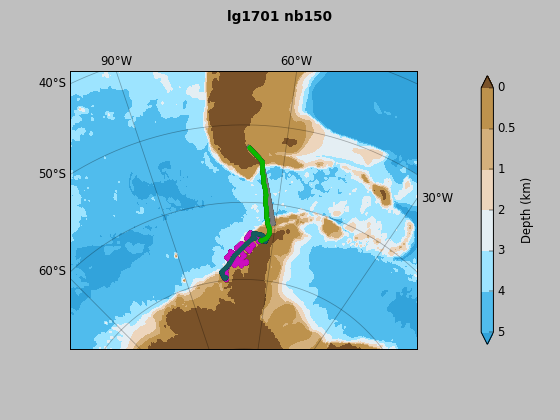
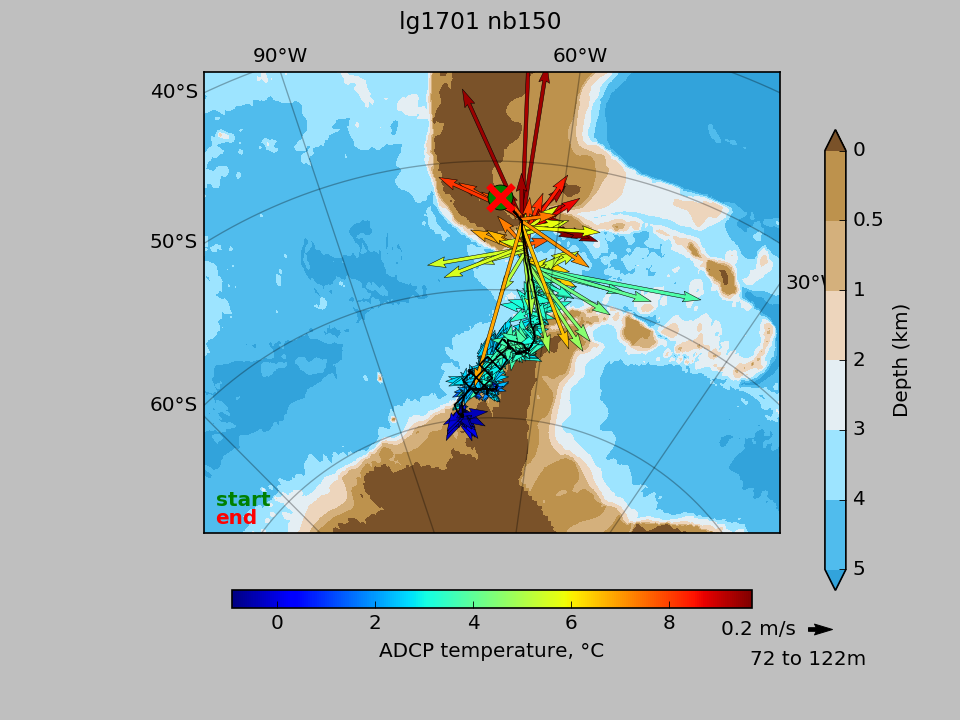
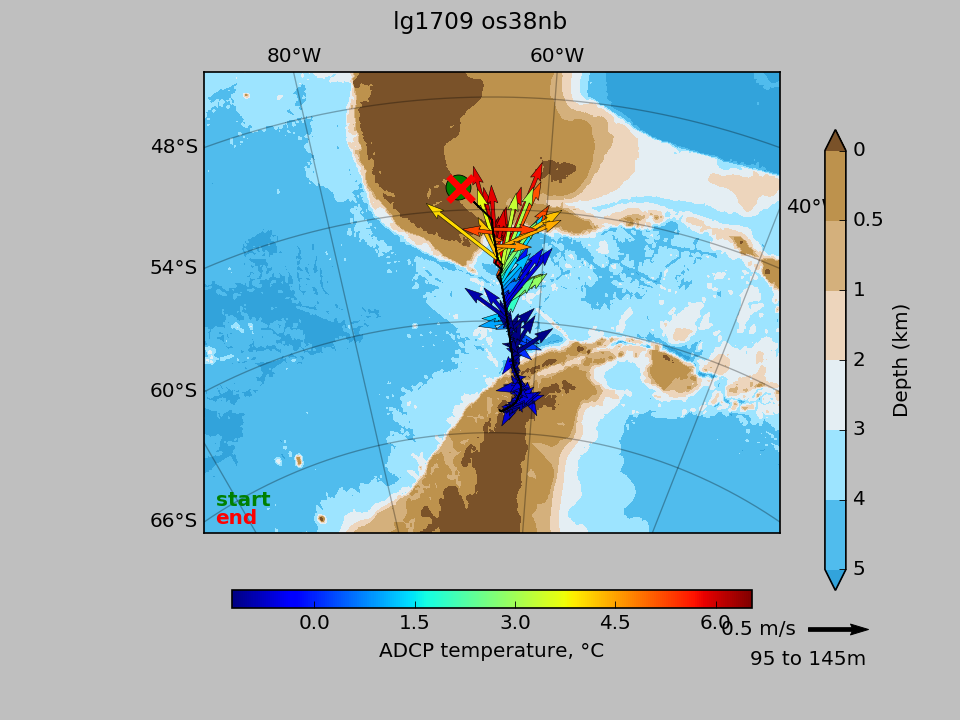
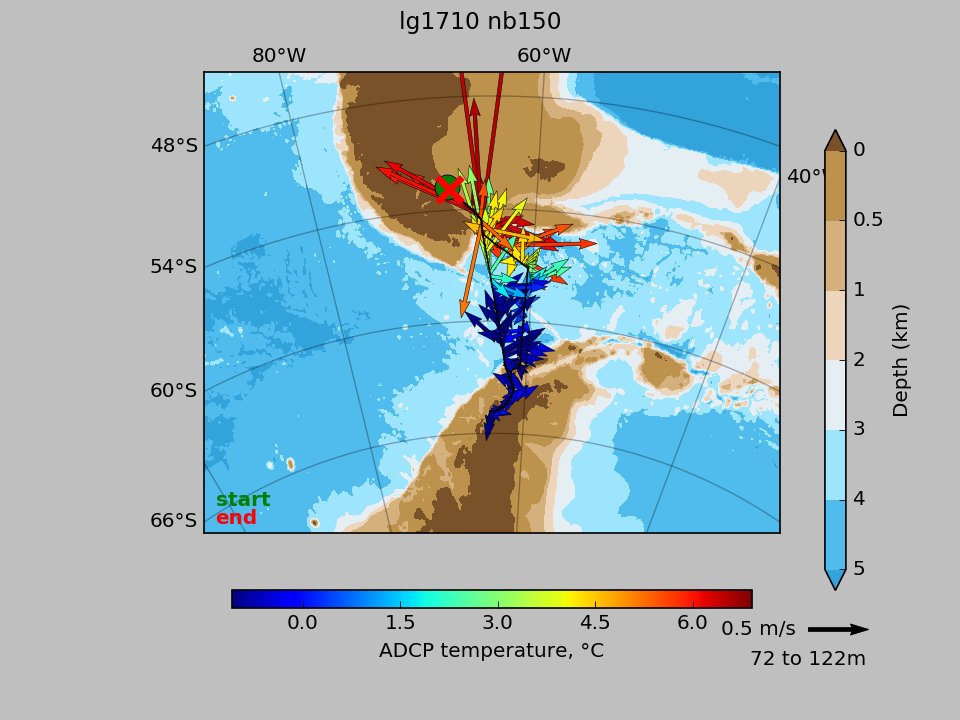
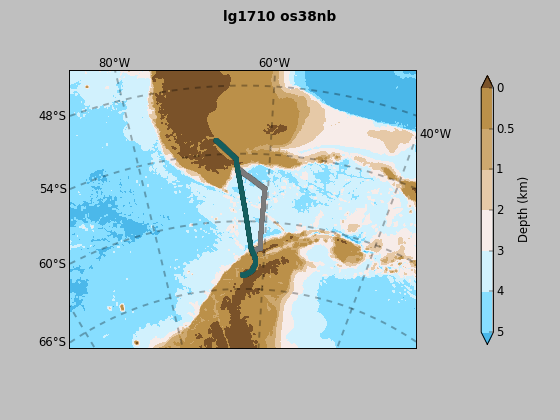
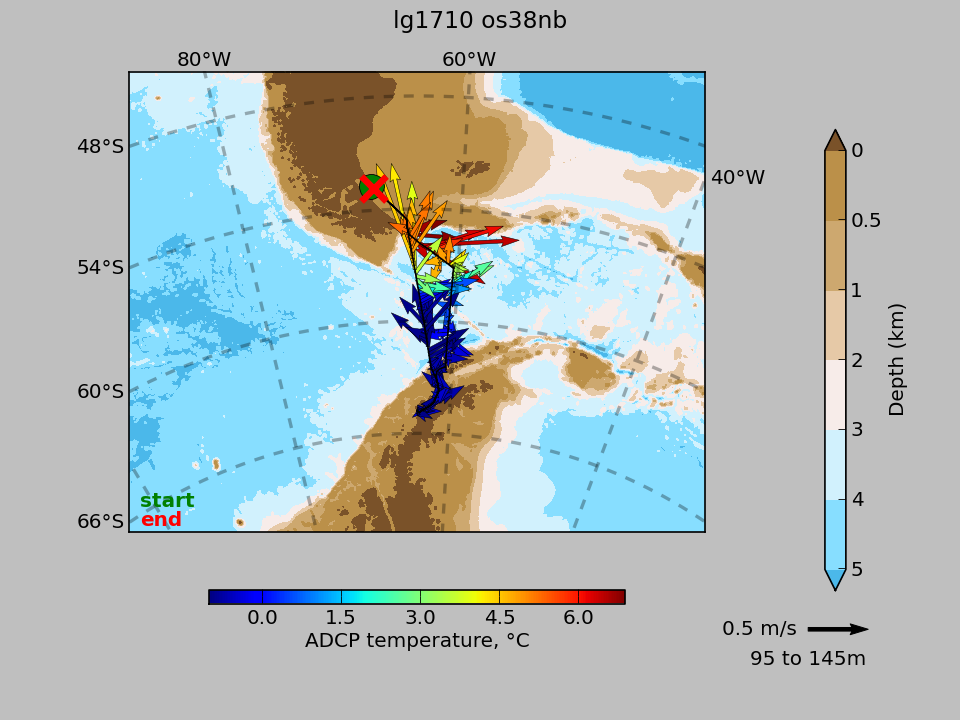
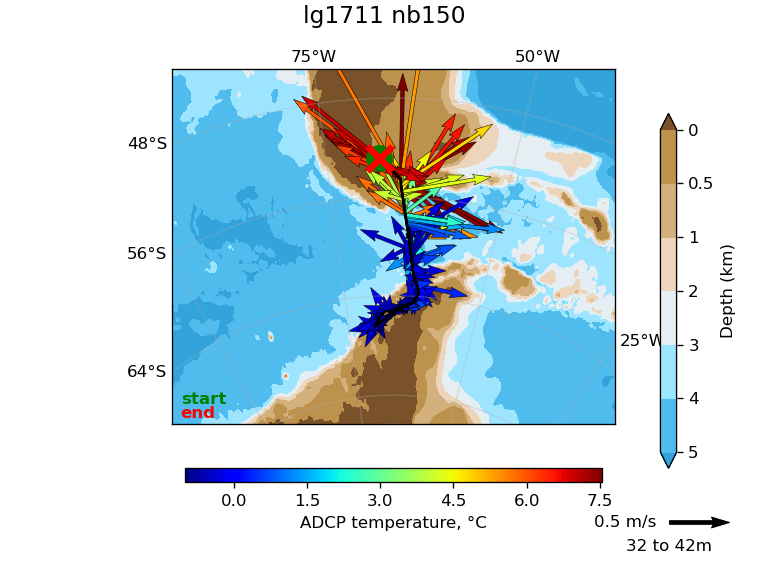
This study seeks to better understand the spatial distribution of mixing rates that drive the MOC in this region, especially in the currently undersampled surface boundary layer (upper 1000 meters).
Sep 2017
examine data
or download
png of map or (back to top)
or link to JASADCP
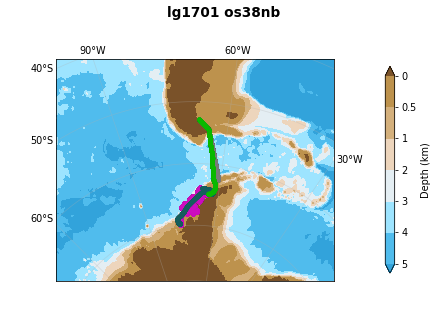
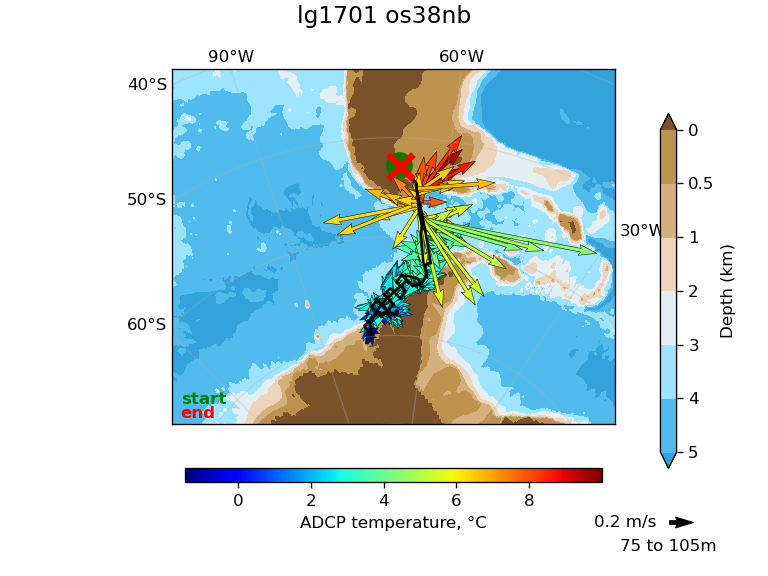
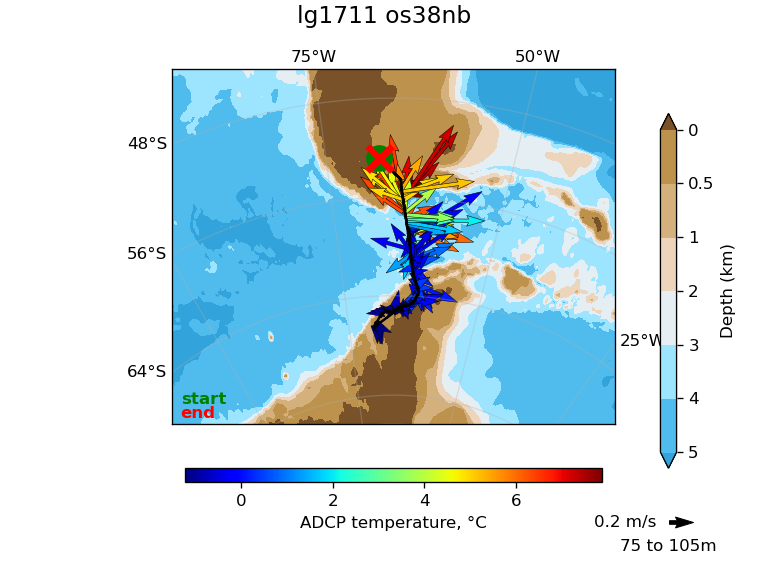
This study seeks to better understand the spatial distribution of mixing rates that drive the MOC in this region, especially in the currently undersampled surface boundary layer (upper 1000 meters).
Sep 2017
examine data
or download
png of map or (back to top)
or link to JASADCP

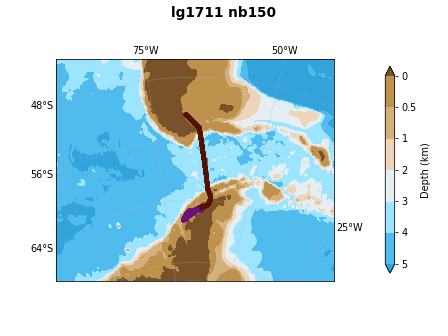
XBT/XCTD Palmer Station Opening
Oct 2017
examine data
or download
png of map or (back to top)
or link to JASADCP

XBT/XCTD Palmer Station Opening
Oct 2017
examine data
or download
png of map or (back to top)
or link to JASADCP

Palmer Science Movements/Shirreff Opening
Oct 2017 - Nov 2017
examine data
or download
png of map or (back to top)
or link to JASADCP
Palmer Science Movements/Shirreff Opening
Oct 2017 - Nov 2017
examine data
or download
png of map or (back to top)
or link to JASADCP
Characterization of the diurnal, and seasonal variability in the CO2 system on the West Antarctic Peninsula continental shelf from autonomous moored platforms.
Nov 2017
examine data
or download
png of map or (back to top)
or link to JASADCP

Nov 2017
examine data
or download
png of map or (back to top)
or link to JASADCP

LTER site visit
Dec 2017
examine data
or download
png of map or (back to top)
or link to JASADCP
LTER site visit
Dec 2017
examine data
or download
png of map or (back to top)
or link to JASADCP