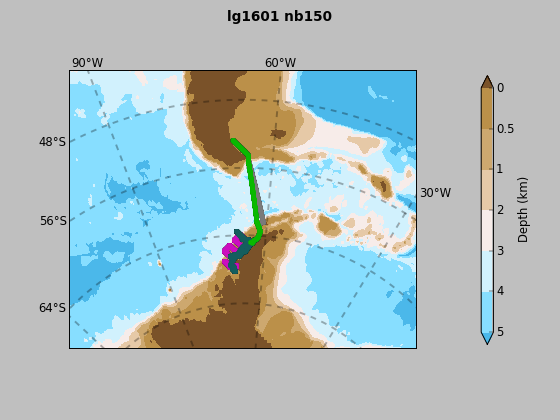
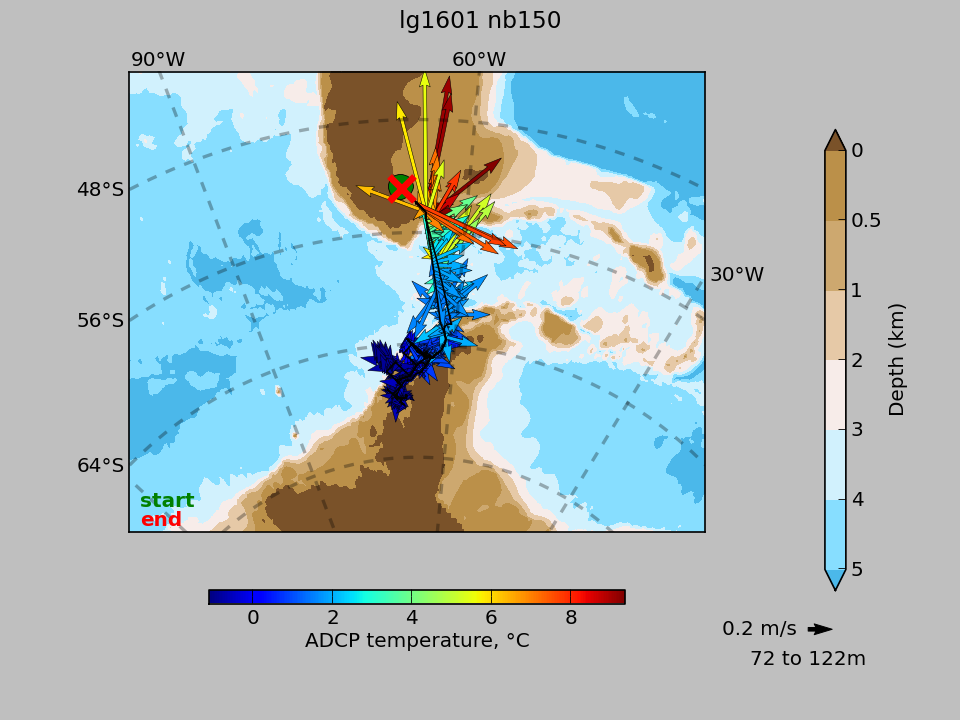
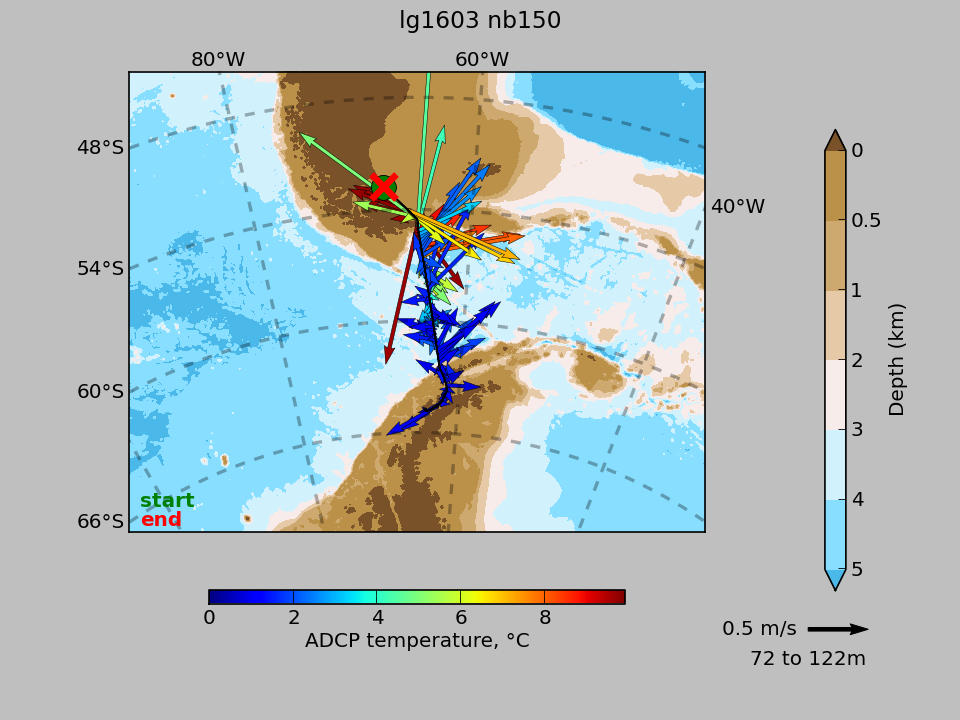
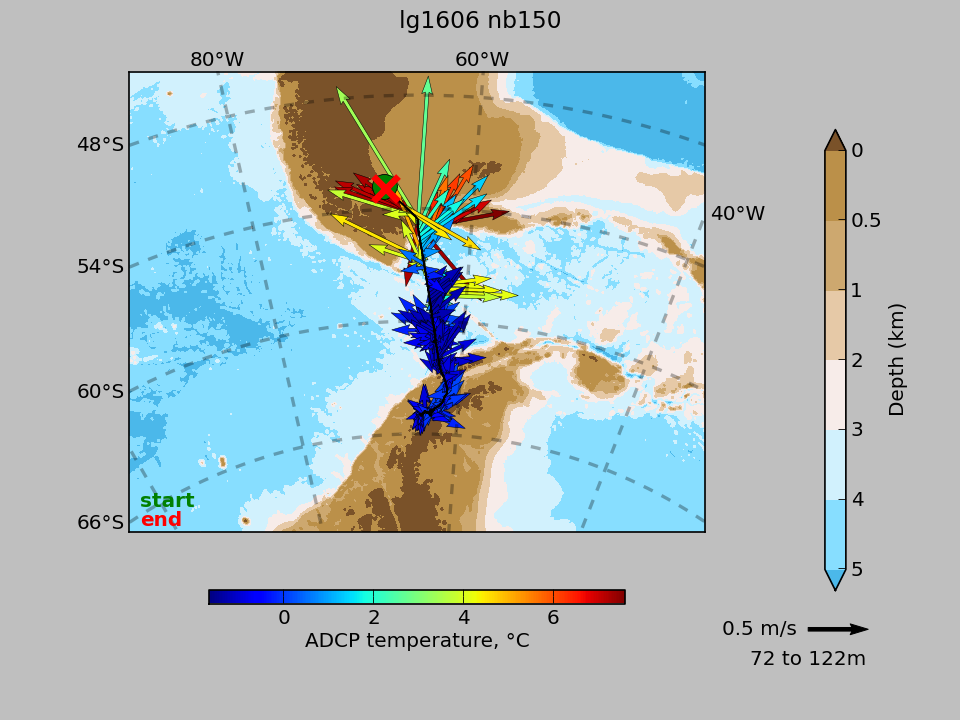
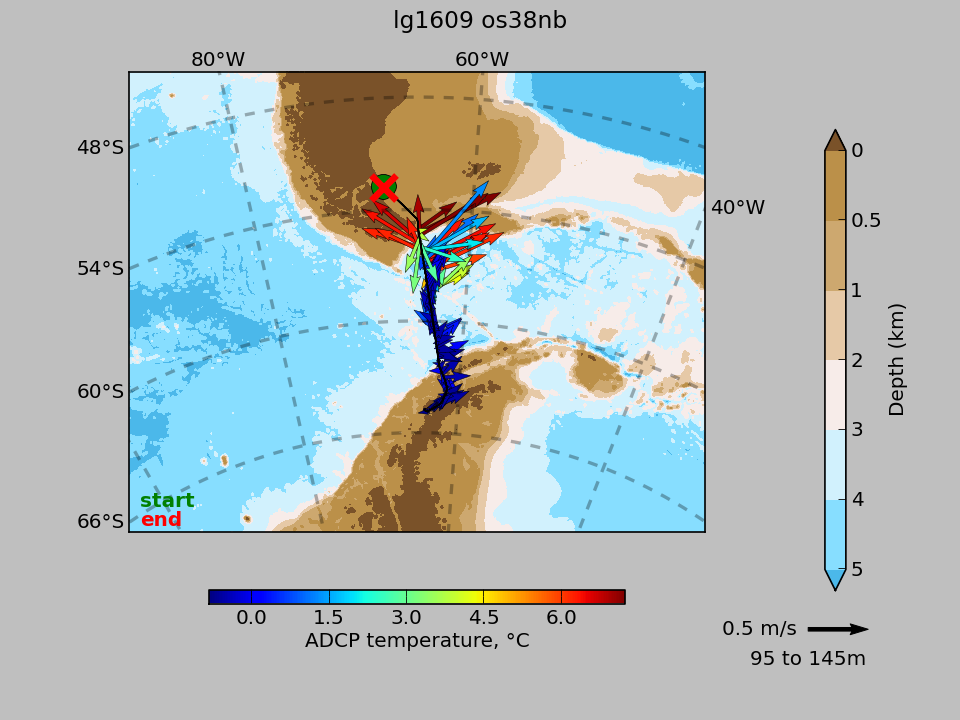
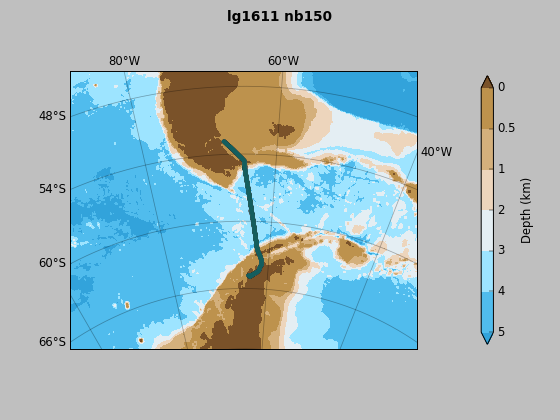
Long-Term Ecological Research (LTER) on the Antarctic Marine Ecosystem : To document/understand the phenology and variability in sea ice dynamics, primary production, zooplankton ecology, Adelie penguin demography, microbial and biogeochemical processes in the Antarctic marine ecosystem.
Jan 2016 - Feb 2016
examine data
or download
png of map or (back to top)
or link to JASADCP
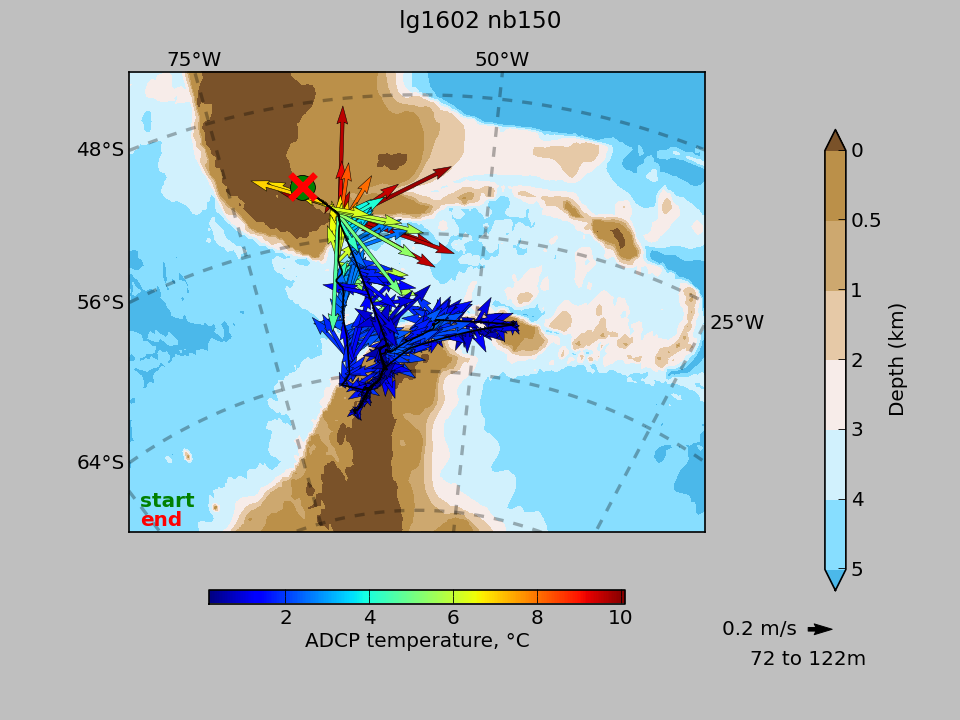
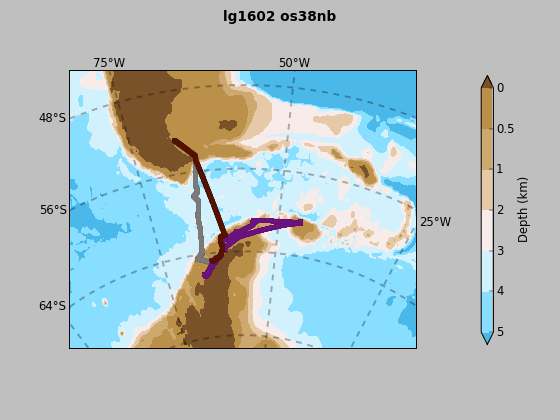
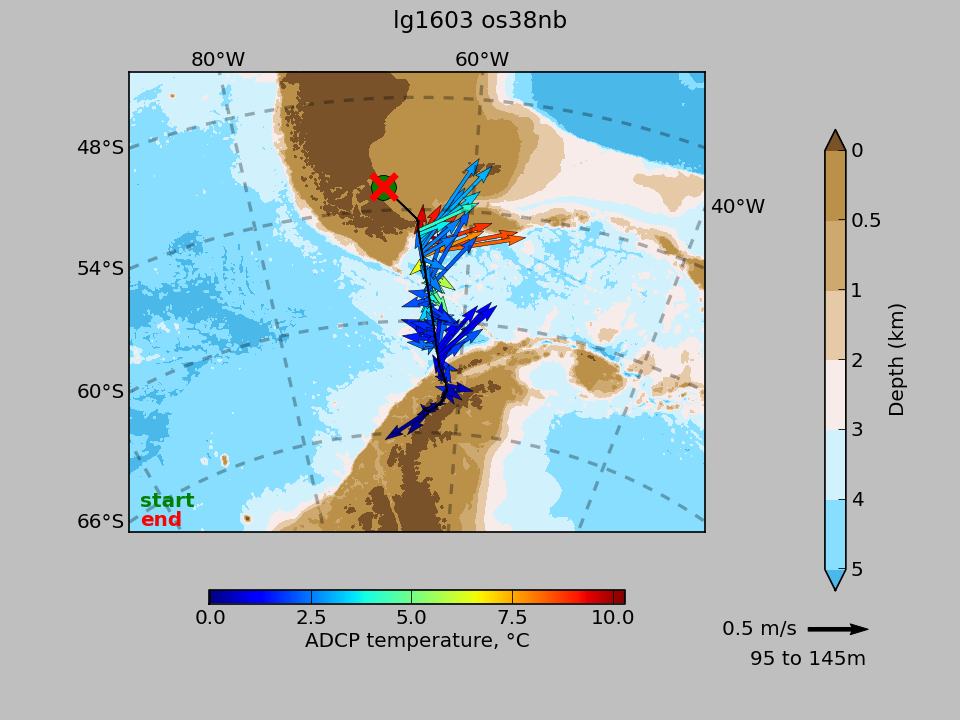
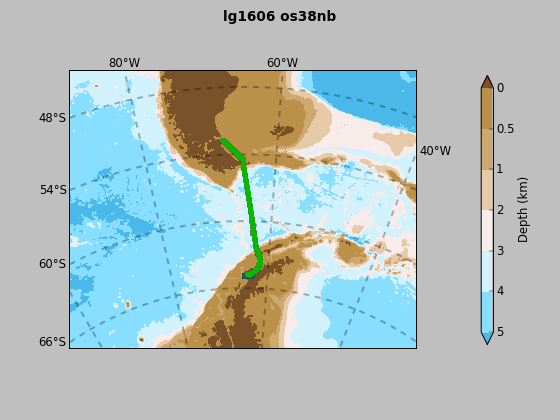
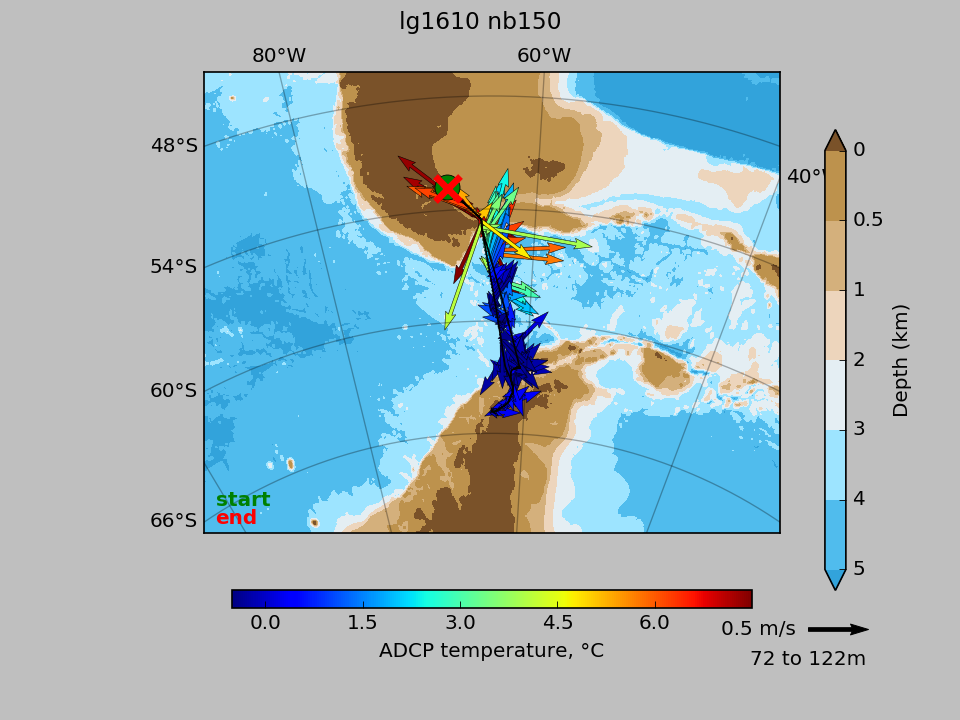
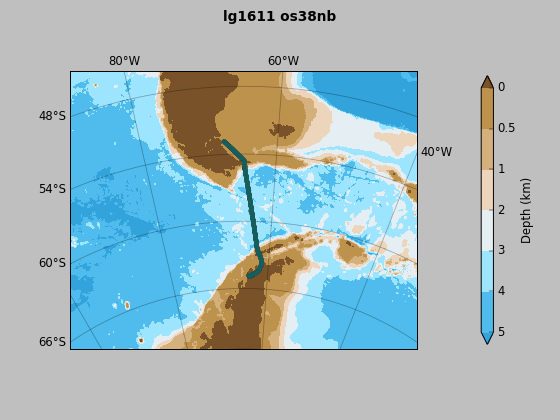
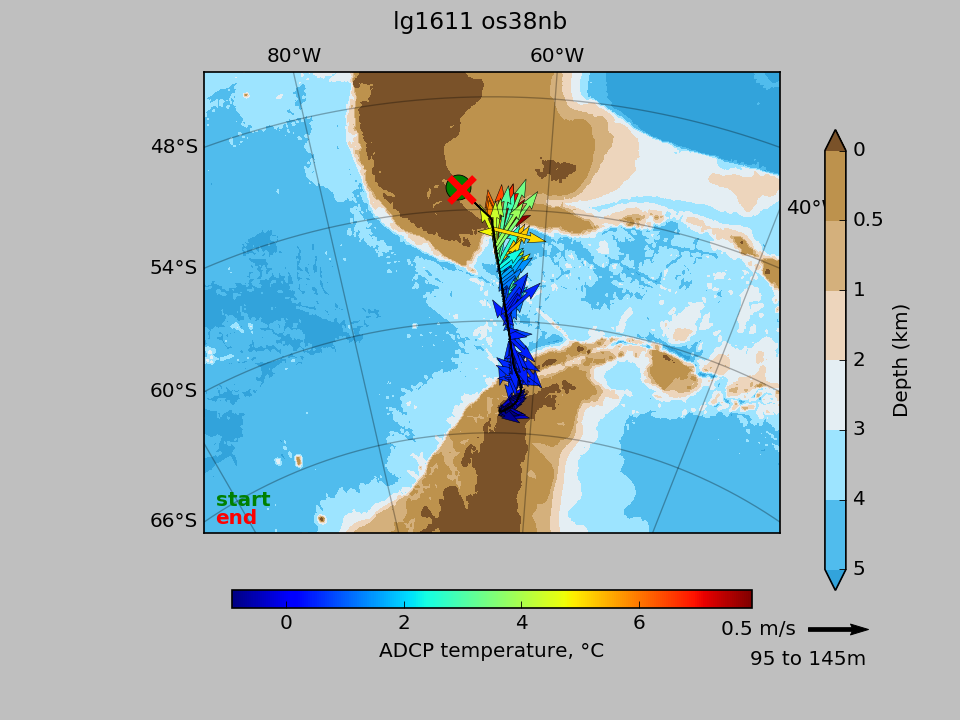

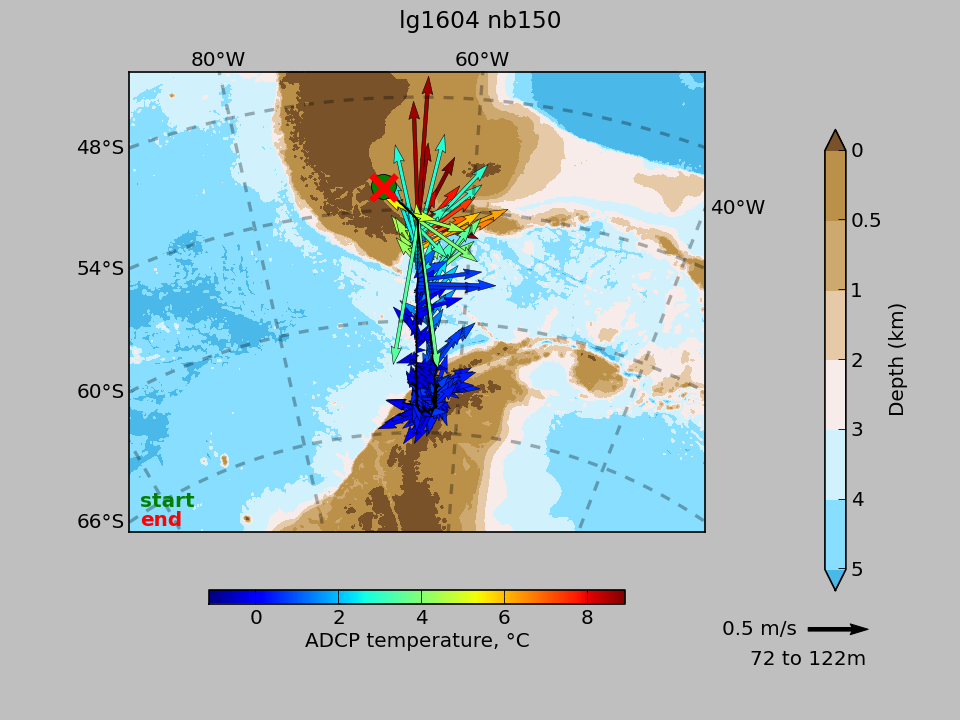
To increase our understanding of current biogeography and diversity by providing in-depth knowledge of soil community composition and complexity as it relates to environmental (above- and belowground) and climatic characteristics; and (2) determine the nature of aboveground-belowground community linkages over varying spatial scales, quantifying how the strength of linkages changes along the gradient.
Feb 2016 - Mar 2016
examine data
or download
png of map or (back to top)
or link to JASADCP
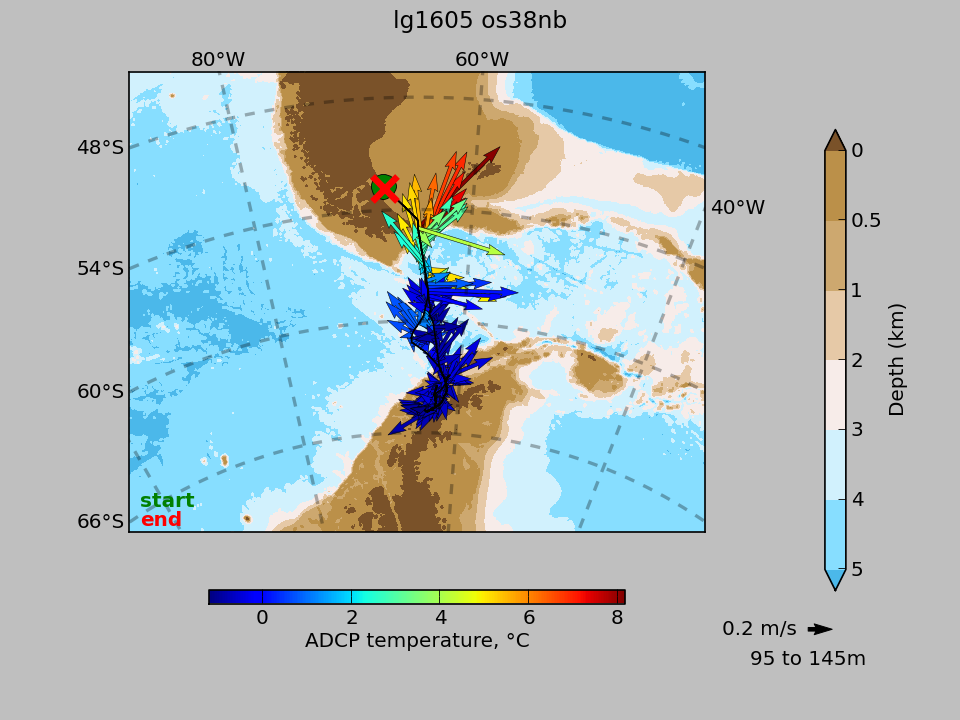

Palmer Station Turnover
Mar 2016 - Apr 2016
examine data
or download
png of map or (back to top)
or link to JASADCP

Palmer Station Turnover
Mar 2016 - Apr 2016
examine data
or download
png of map or (back to top)
or link to JASADCP

To understand the molecular and physiological capacities of Antarctic notothenioid fishes to acclimatize and/or adapt to rapid oceanic warming
Apr 2016 - May 2016
examine data
or download
png of map or (back to top)
or link to JASADCP

To understand the molecular and physiological capacities of Antarctic notothenioid fishes to acclimatize and/or adapt to rapid oceanic warming
Apr 2016 - May 2016
examine data
or download
png of map or (back to top)
or link to JASADCP

To understand the molecular and physiological capacities of Antarctic notothenioid fishes to acclimatize and/or adapt to rapid oceanic warming
May 2016 - June 2016
examine data
or download
png of map or (back to top)
or link to JASADCP

To understand the molecular and physiological capacities of Antarctic notothenioid fishes to acclimatize and/or adapt to rapid oceanic warming
May 2016 - June 2016
examine data
or download
png of map or (back to top)
or link to JASADCP

To introduce students to the diversity of biological organisms in Antarctic polar regions, to study unique aspects of biology that permit life in such extreme environments and to provide the opportunity for scientists new to the Antarctic to learn about and appreciate the logistical possibilities and constraints of working in this extreme environment.
Jun 2016 - Aug 2016
examine data
or download
png of map or (back to top)
or link to JASADCP
XBT/XCTD Palmer Station Opening
Oct 2016
examine data
or download
png of map or (back to top)
or link to JASADCP

XBT/XCTD Palmer Station Opening
Oct 2016
examine data
or download
png of map or (back to top)
or link to JASADCP

Palmer Science Movements/Shirreff Opening
Oct 2016 - Nov 2016
examine data
or download
png of map or (back to top)
or link to JASADCP
Palmer Science Movements/Shirreff Opening
Oct 2016 - Nov 2016
examine data
or download
png of map or (back to top)
or link to JASADCP
Logistics Cruise
Nov 2016
examine data
or download
png of map or (back to top)
or link to JASADCP
Logistics Cruise
Nov 2016
examine data
or download
png of map or (back to top)
or link to JASADCP

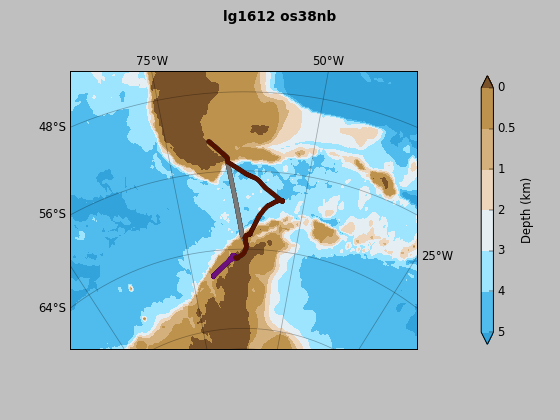
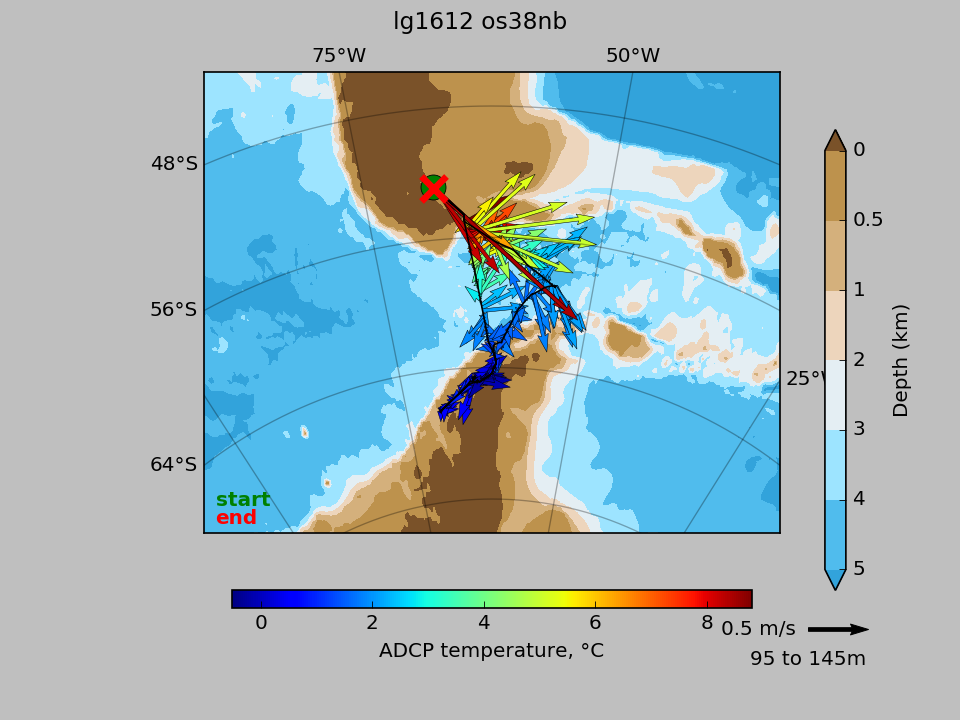
Characterization of the diurnal, and seasonal variability in the CO2 system on the West Antarctic Peninsula continental shelf from autonomous moored platforms.
Dec 2016
examine data
or download
png of map or (back to top)
or link to JASADCP
Characterization of the diurnal, and seasonal variability in the CO2 system on the West Antarctic Peninsula continental shelf from autonomous moored platforms.
Dec 2016
examine data
or download
png of map or (back to top)
or link to JASADCP