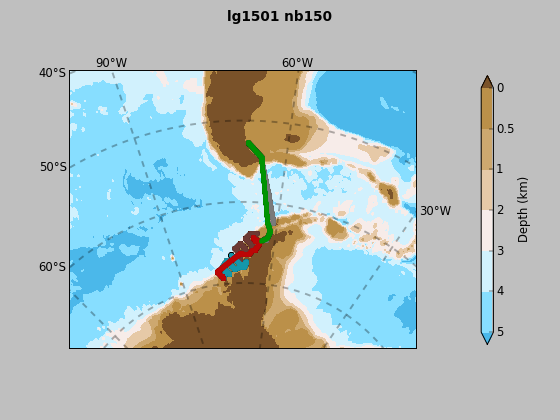
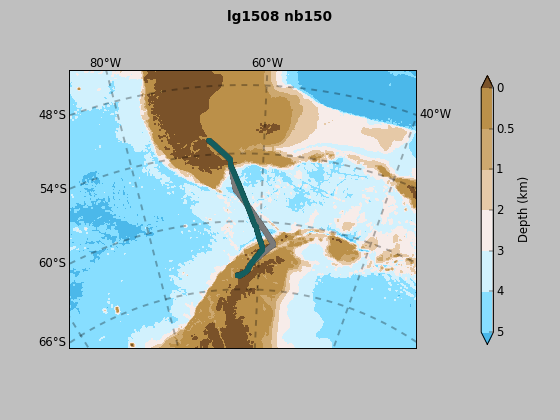
Long-Term Ecological Research (LTER) on the Antarctic Marine Ecosystem : To document/understand the phenology and variability in sea ice dynamics, primary production, zooplankton ecology, Adelie penguin demography, microbial and biogeochemical processes in the Antarctic marine ecosystem.
Jan 2015 - Feb 2015
examine data
or download
png of map or (back to top)
or link to JASADCP
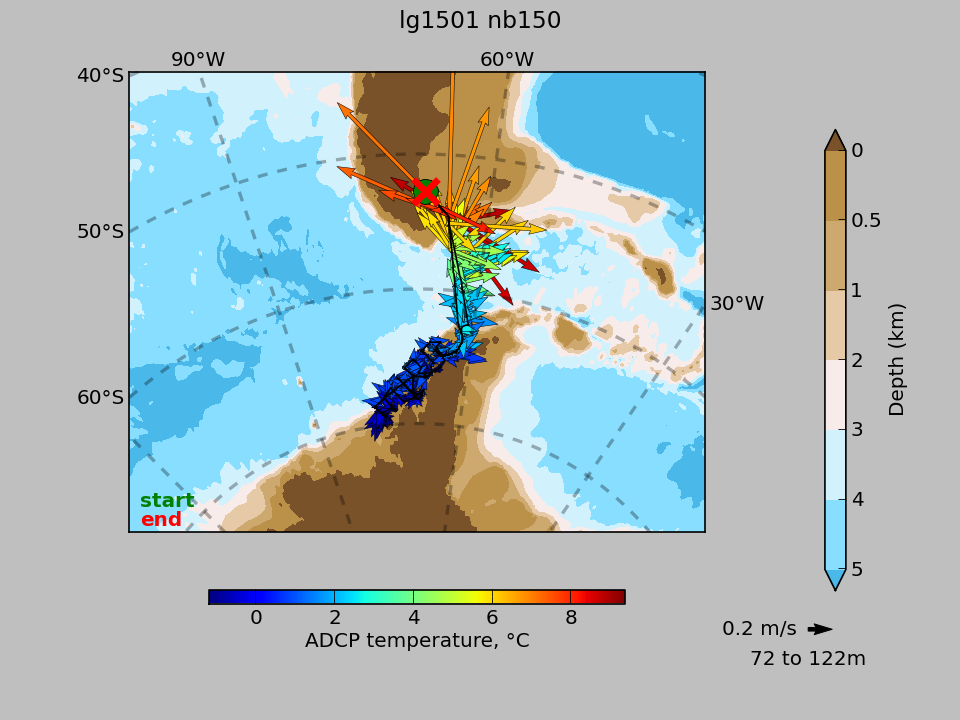
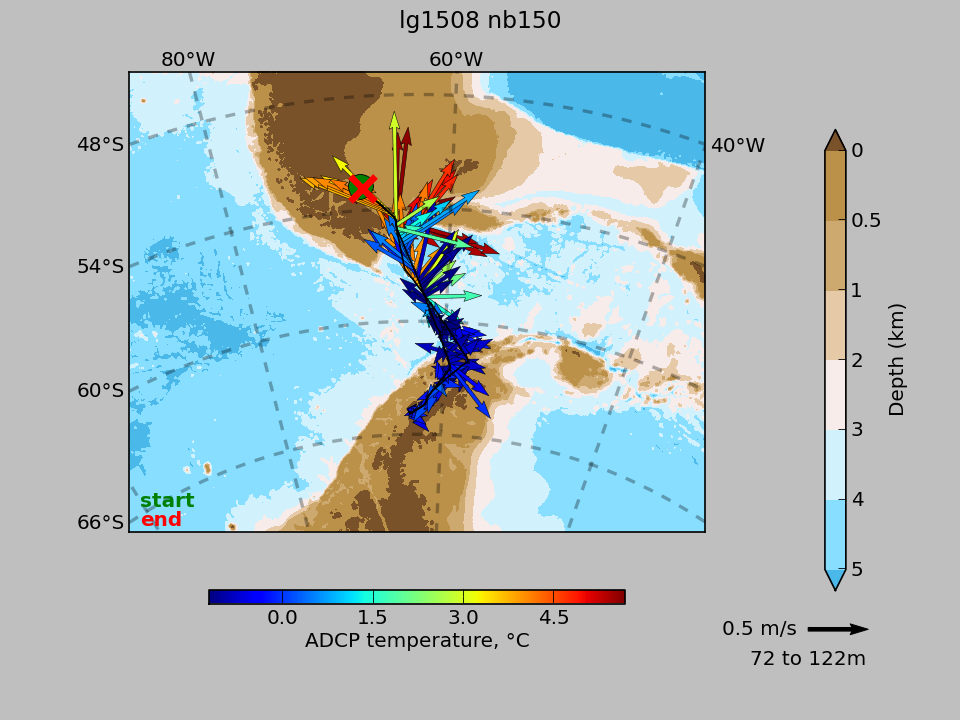

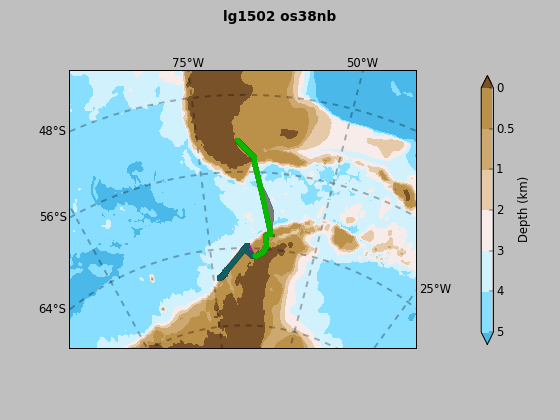
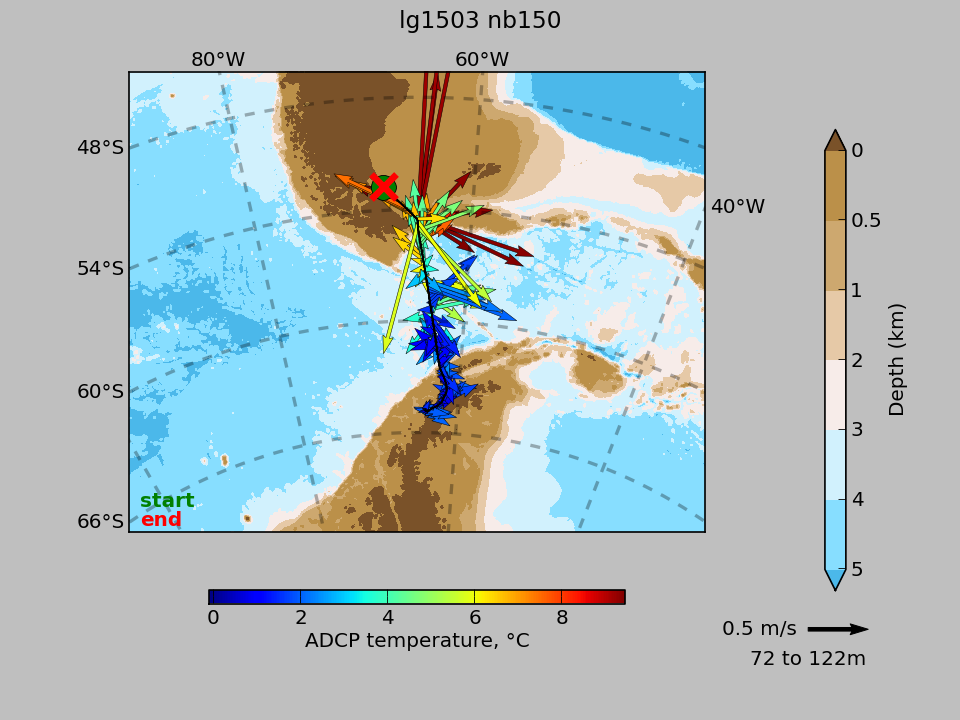
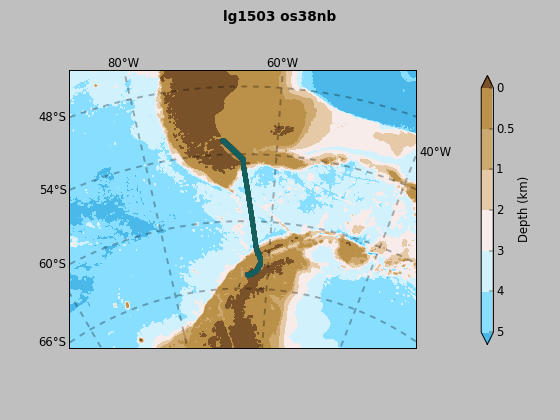
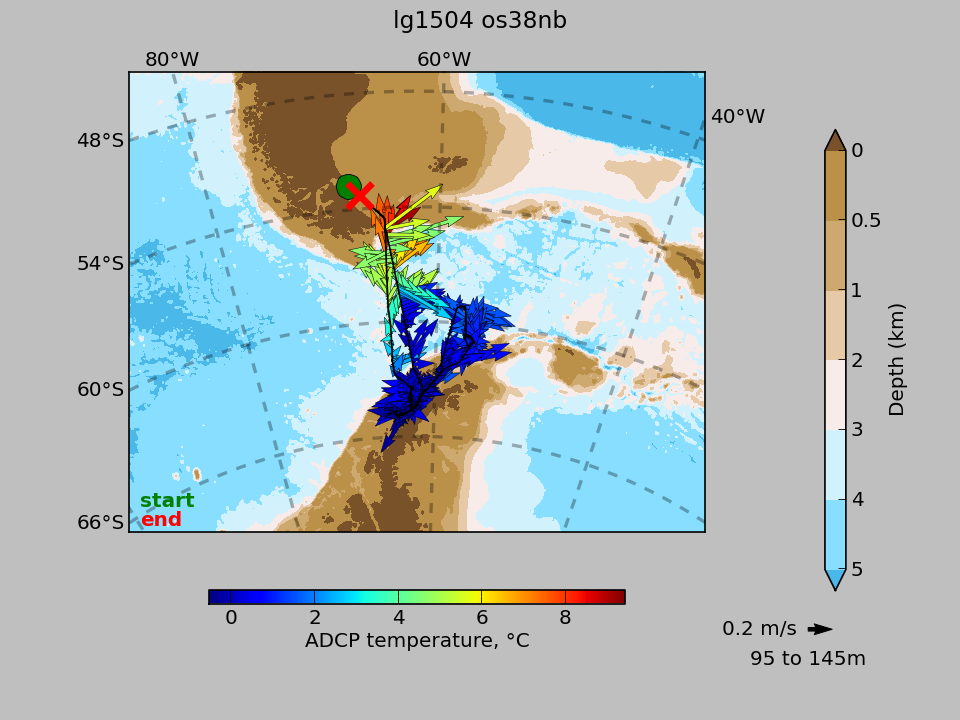
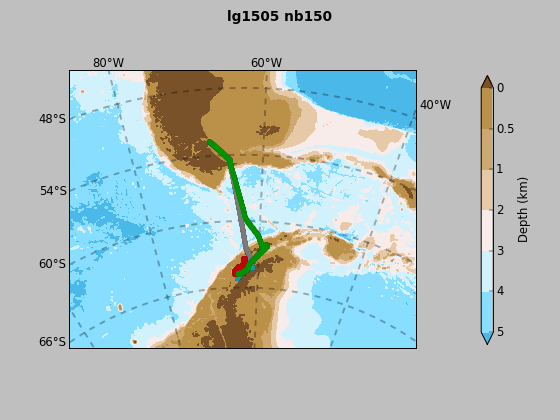
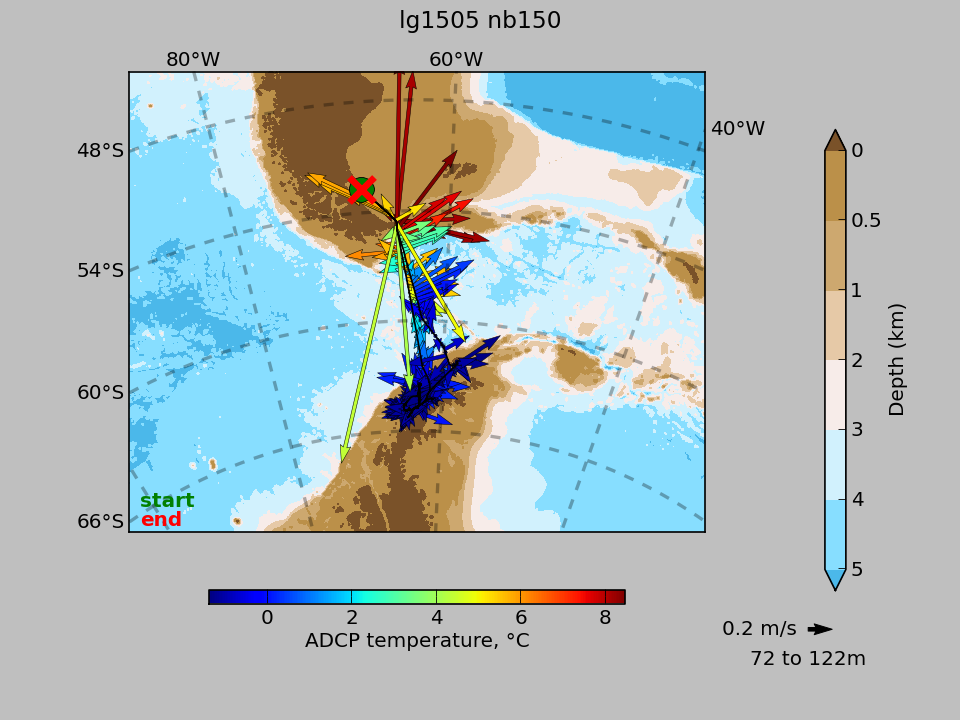
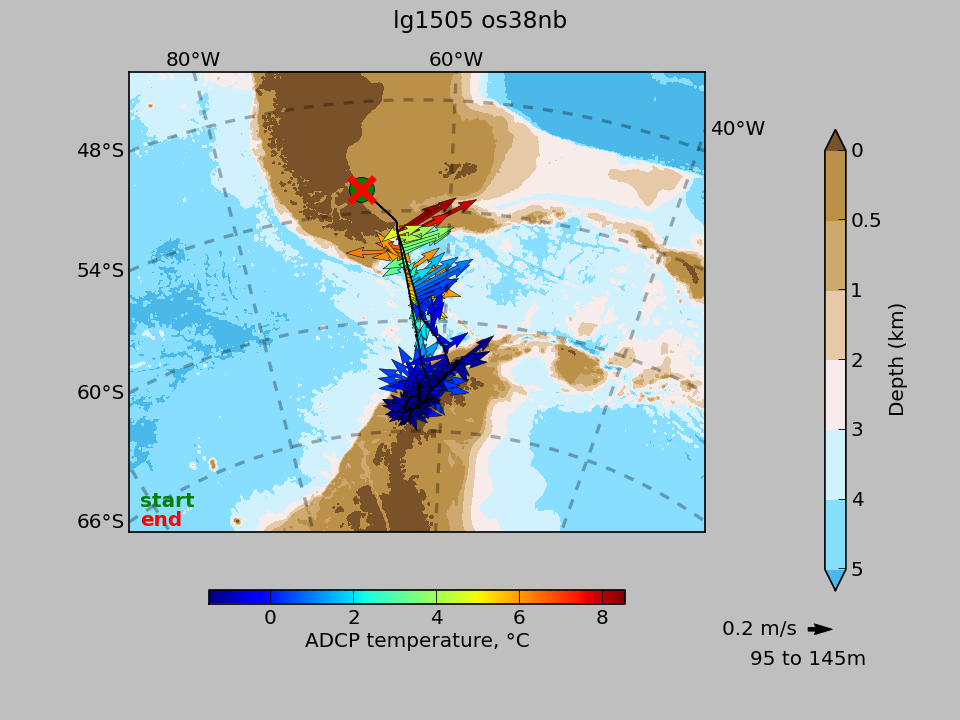
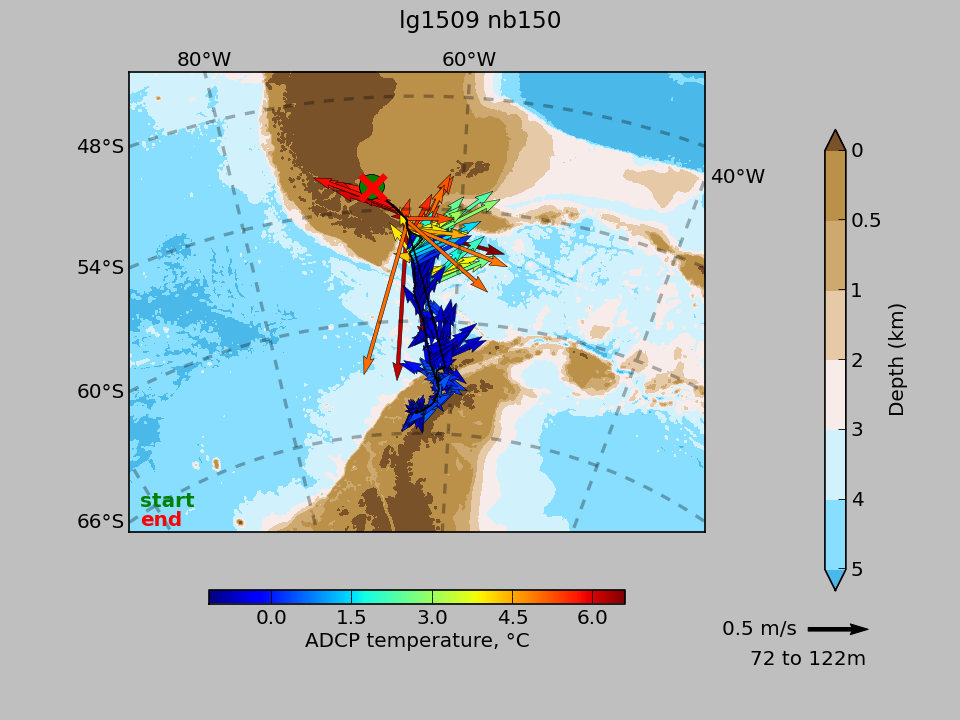
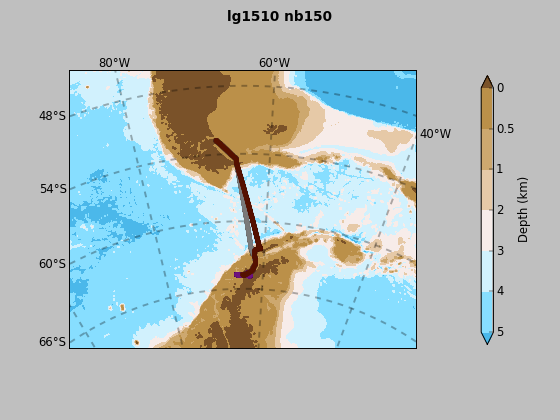
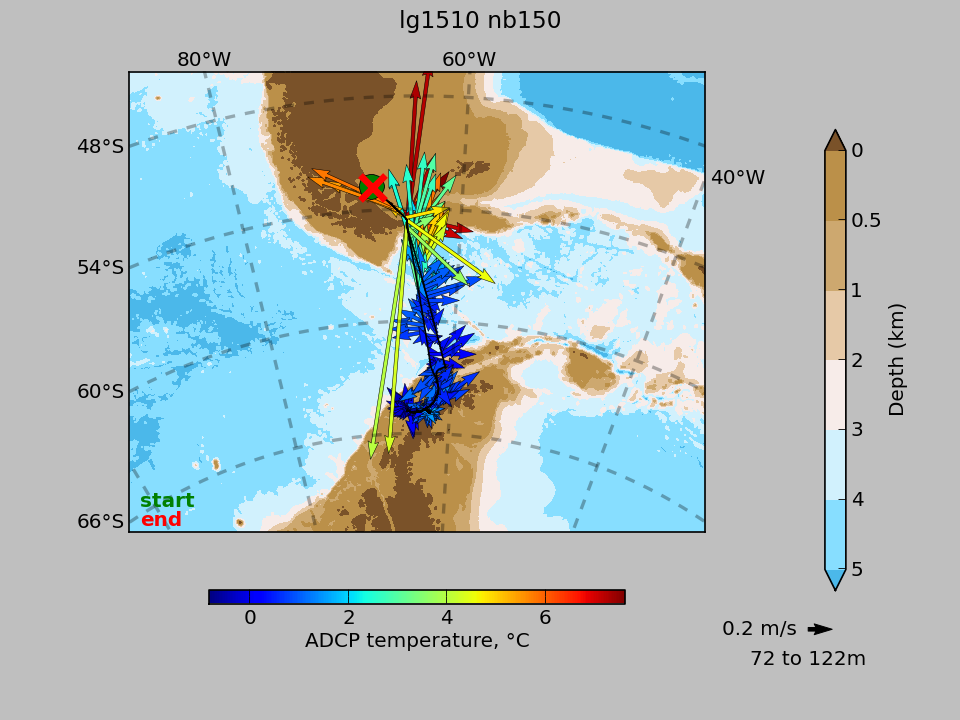
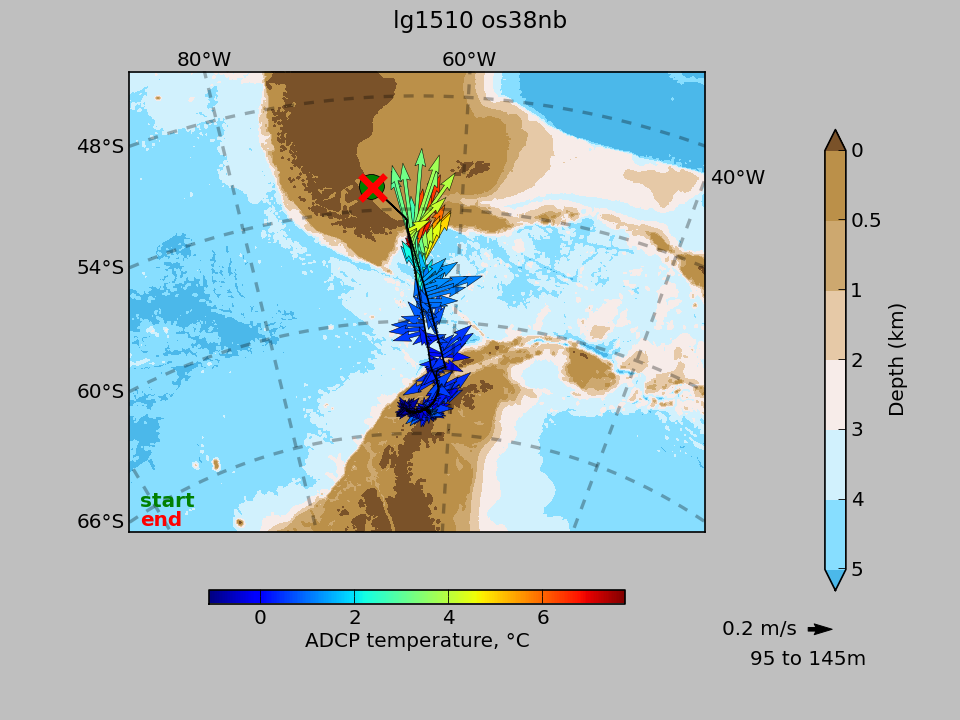
To assess the status, viability, and ecological impacts of populations of potentially invading, predatory king crabs in the Bellingshausen Sea.
Feb 2015 - Mar 2015
examine data
or download
png of map or (back to top)
or link to JASADCP
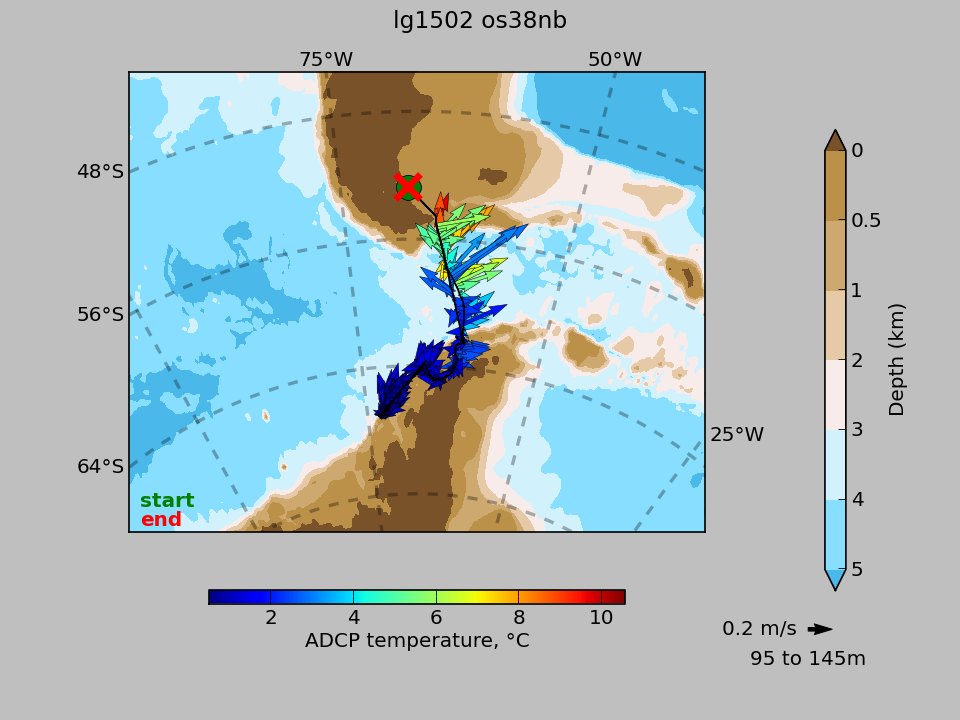
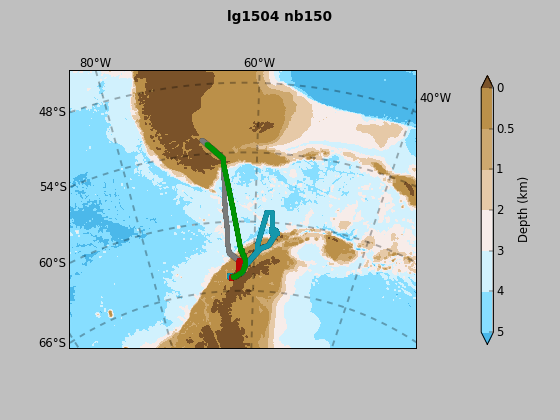
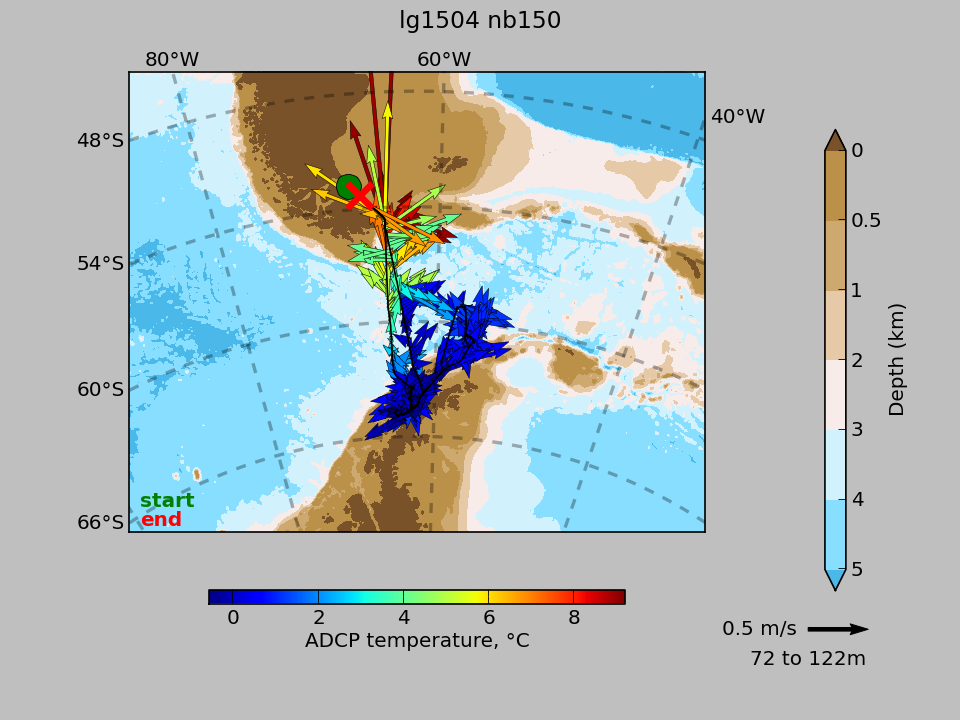
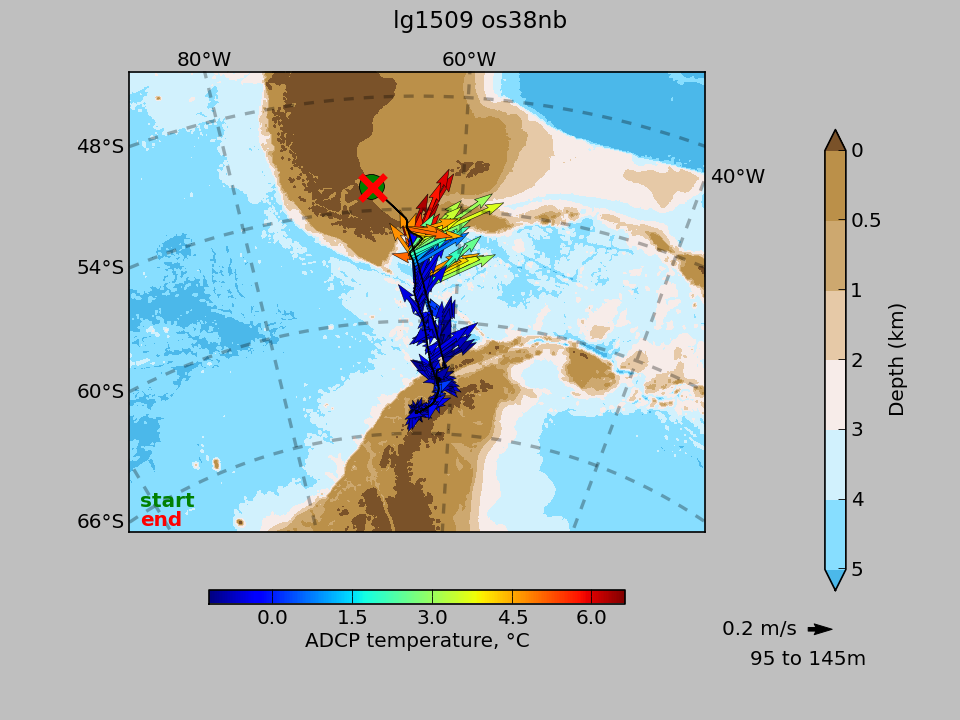
To assess the status, viability, and ecological impacts of populations of potentially invading, predatory king crabs in the Bellingshausen Sea.
Feb 2015 - Mar 2015
examine data
or download
png of map or (back to top)
or link to JASADCP

Palmer Station Turnover
Mar 2015
examine data
or download
png of map or (back to top)
or link to JASADCP
Palmer Station Turnover
Mar 2015
examine data
or download
png of map or (back to top)
or link to JASADCP
To understand the physiological and biochemical mechanisms that define thermal tolerance of Antarctic notothenioids.
Apr 2015 - May 2015
examine data
or download
png of map or (back to top)
or link to JASADCP

To understand the physiological and biochemical mechanisms that define thermal tolerance of Antarctic notothenioids.
Apr 2015 - May 2015
examine data
or download
png of map or (back to top)
or link to JASADCP
To understand the physiological and biochemical mechanisms that define thermal tolerance of Antarctic notothenioids.
May 2015 - Jun 2015
examine data
or download
png of map or (back to top)
or link to JASADCP

To understand the physiological and biochemical mechanisms that define thermal tolerance of Antarctic notothenioids.
May 2015 - Jun 2015
examine data
or download
png of map or (back to top)
or link to JASADCP

XBT/XCTD Shuttle Run
Jun 2015
examine data
or download
png of map or (back to top)
or link to JASADCP

XBT/XCTD Shuttle Run
Jun 2015
examine data
or download
png of map or (back to top)
or link to JASADCP
Palmer Station Turnover
Oct 2015
examine data
or download
png of map or (back to top)
or link to JASADCP

Palmer Station Turnover
Oct 2015
examine data
or download
png of map or (back to top)
or link to JASADCP

To sample the measured convergence and divergence zones with the context of the semi-diurnal tidal regimes. To collect the non-seasonal, brooding scleractinian Flabellum impensum to be brought back to Palmer Station for a month long climate change experiment
Oct 2015 - Nov 2015
examine data
or download
png of map or (back to top)
or link to JASADCP
To determine whether sub-polar WAP fjords are regionally significant hotspots of productivity and biodiversity
Nov 2015 - Dec 2015
examine data
or download
png of map or (back to top)
or link to JASADCP

To determine whether sub-polar WAP fjords are regionally significant hotspots of productivity and biodiversity
Nov 2015 - Dec 2015
examine data
or download
png of map or (back to top)
or link to JASADCP