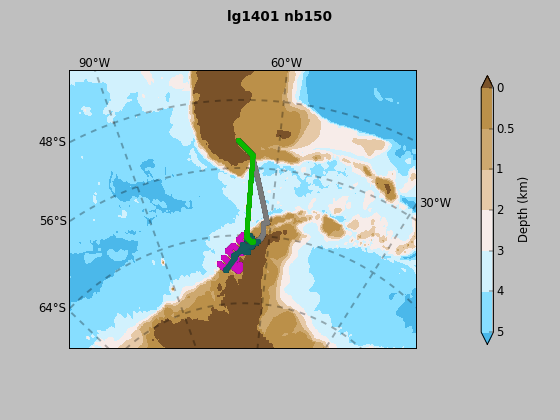
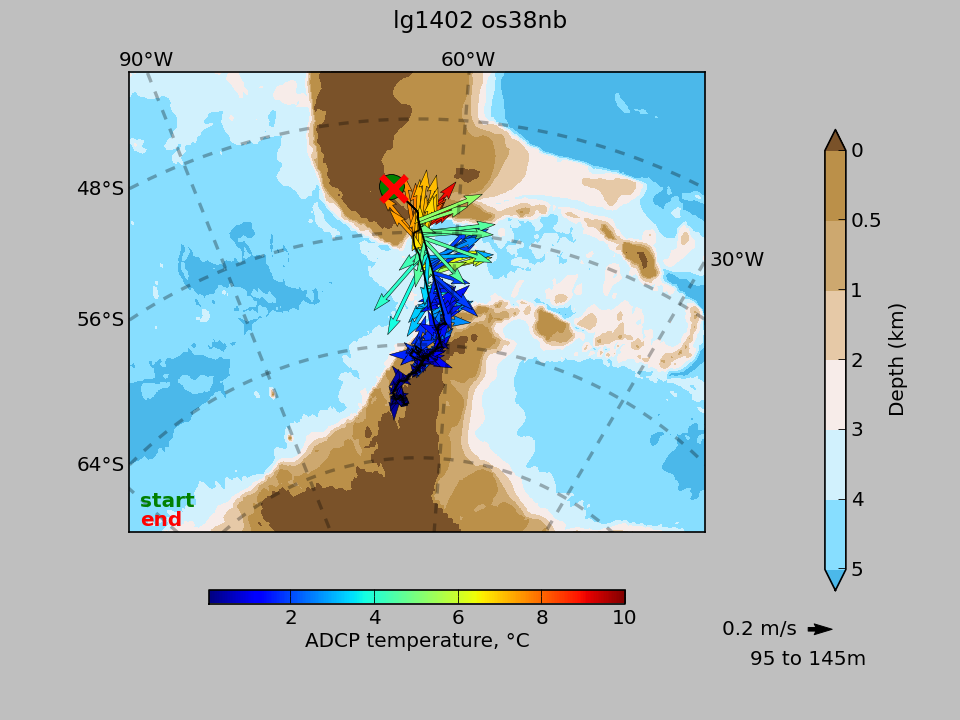
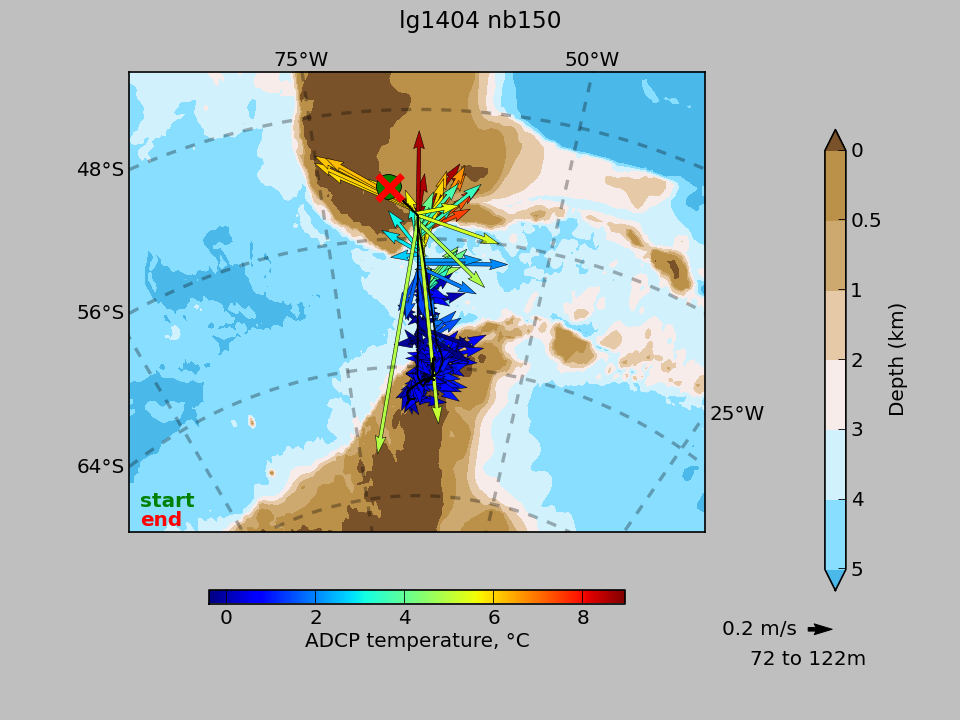
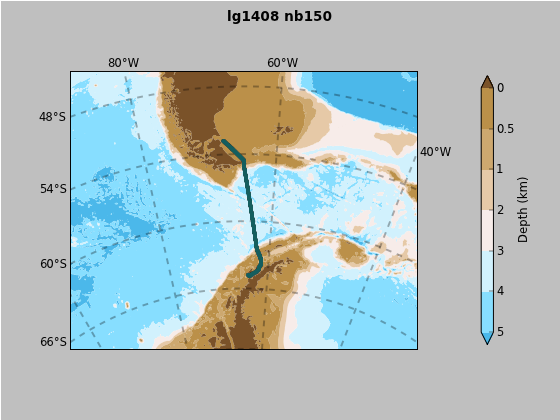
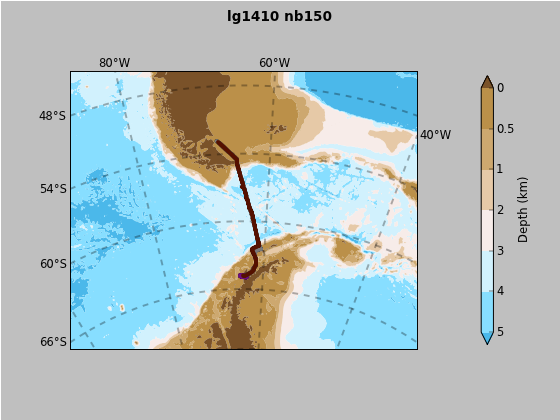
Long-Term Ecological Research on the Antarctic Marine Ecosystem: Physiological and ecosystem structure forcings on carbon fluxes in the Southern Ocean mixed layer (LTER)
Jan 2014 - Feb 2014
examine data
or download
png of map or (back to top)
or link to JASADCP

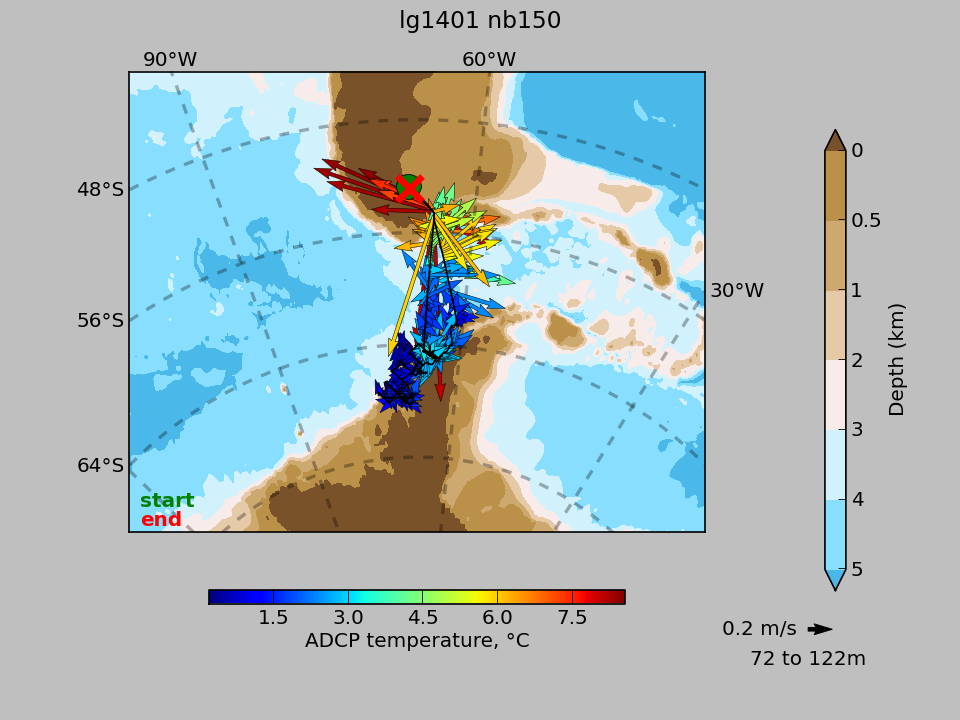
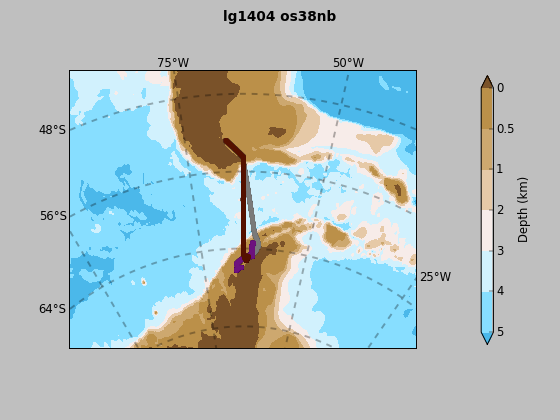
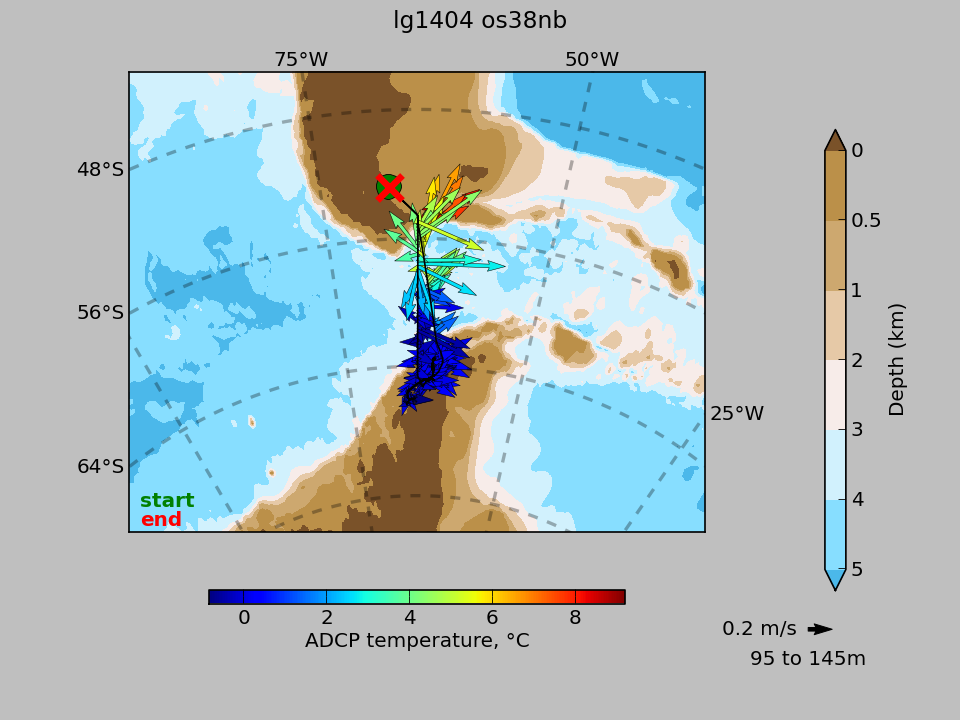
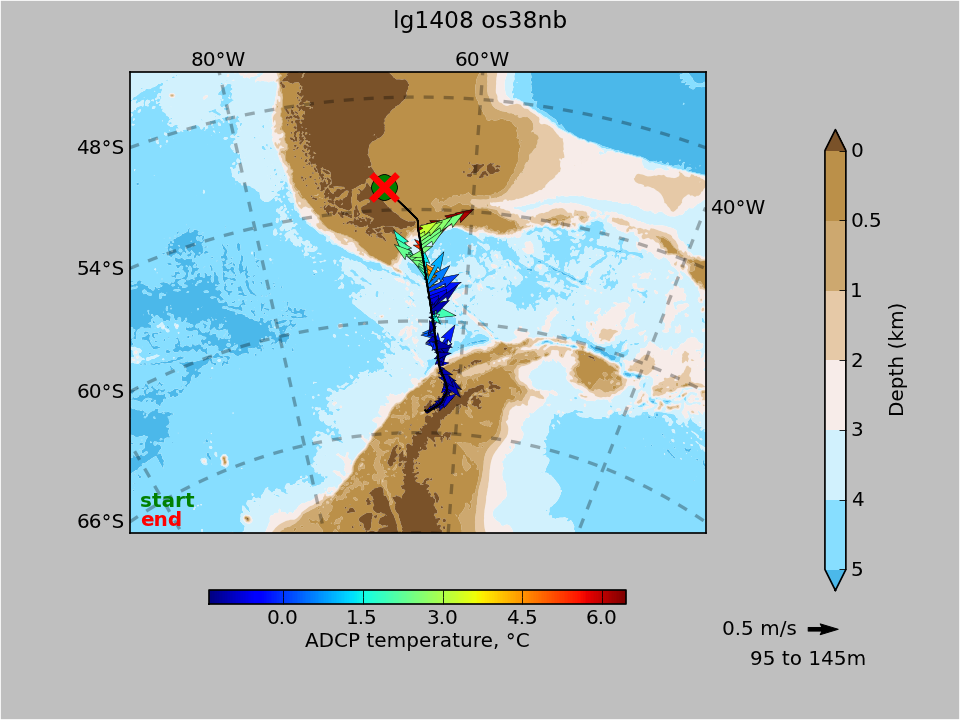
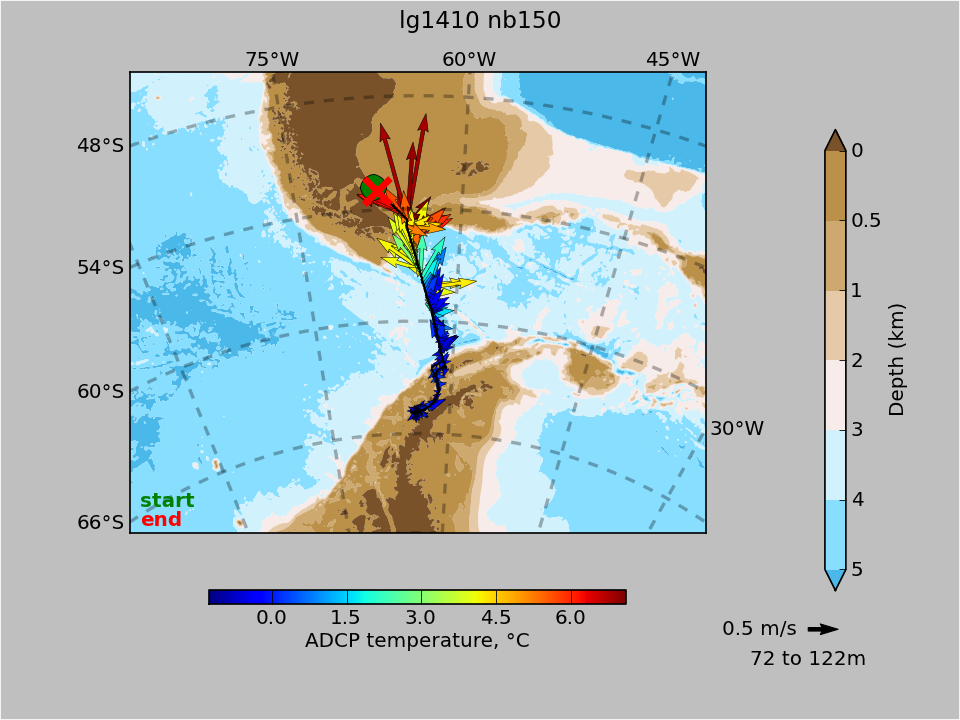
Long-Term Ecological Research on the Antarctic Marine Ecosystem: Physiological and ecosystem structure forcings on carbon fluxes in the Southern Ocean mixed layer (LTER)
Jan 2014 - Feb 2014
examine data
or download
png of map or (back to top)
or link to JASADCP
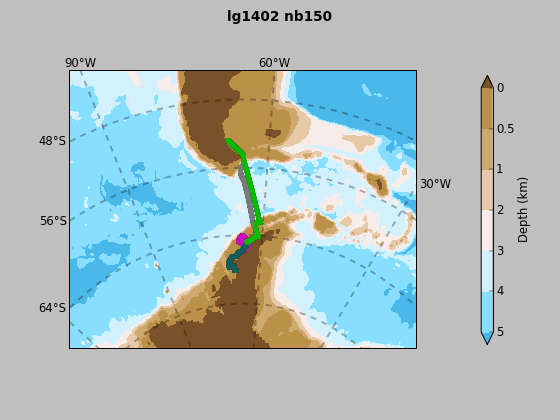
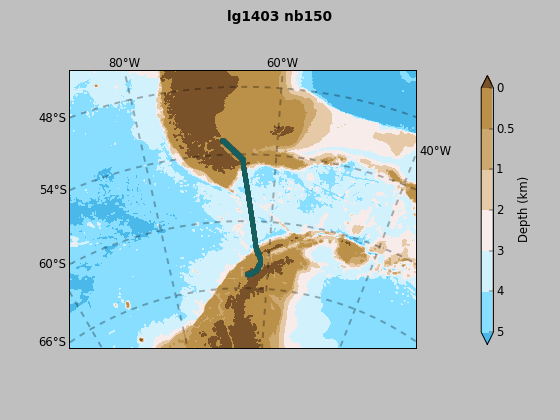
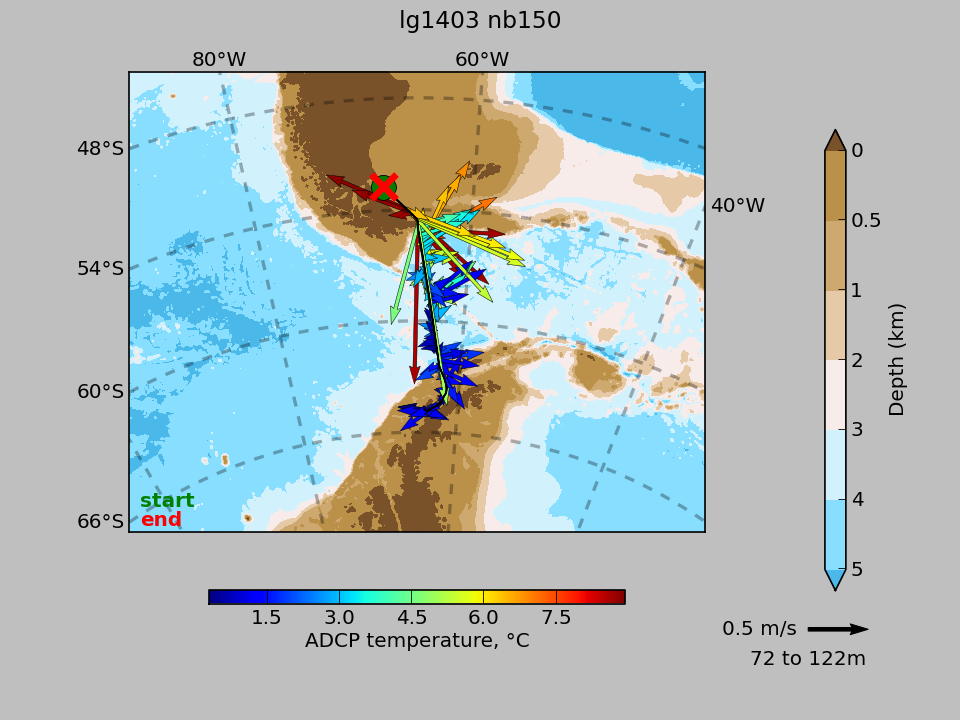
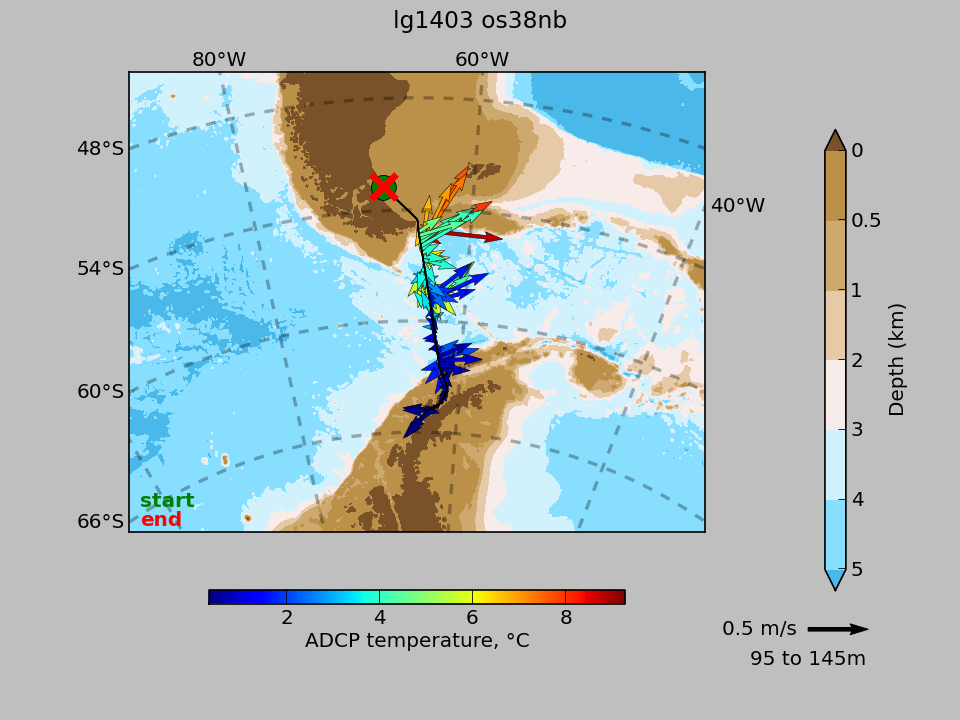
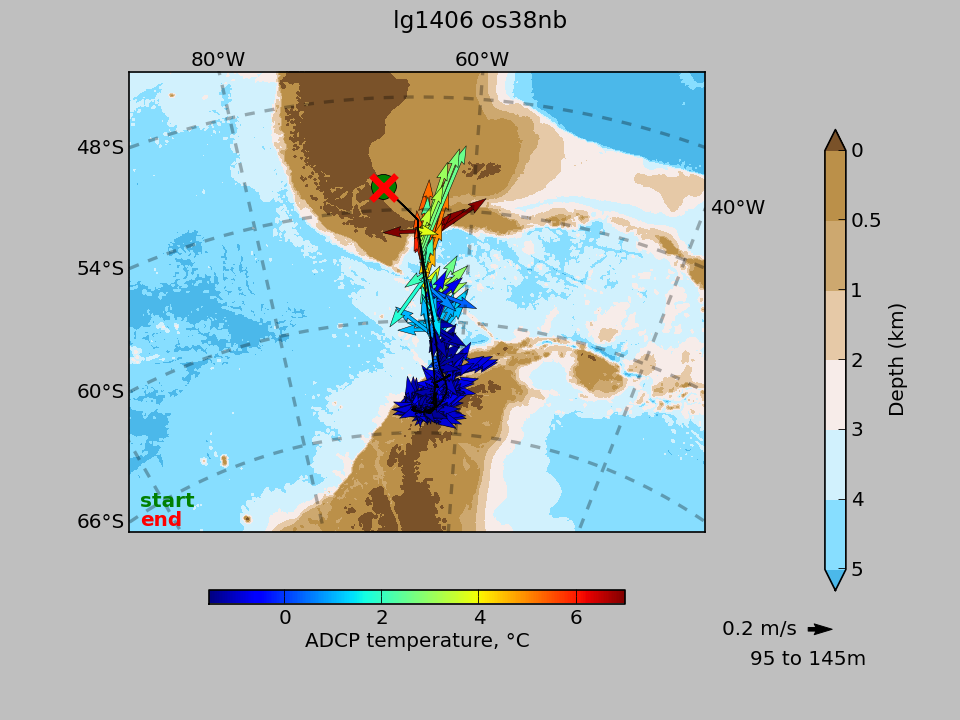
Collaborative Research: Submarine Groundwater and Freshwater Inputs Along the Western Antarctic Peninsula
Feb 2014 - Mar 2014
examine data
or download
png of map or (back to top)
or link to JASADCP

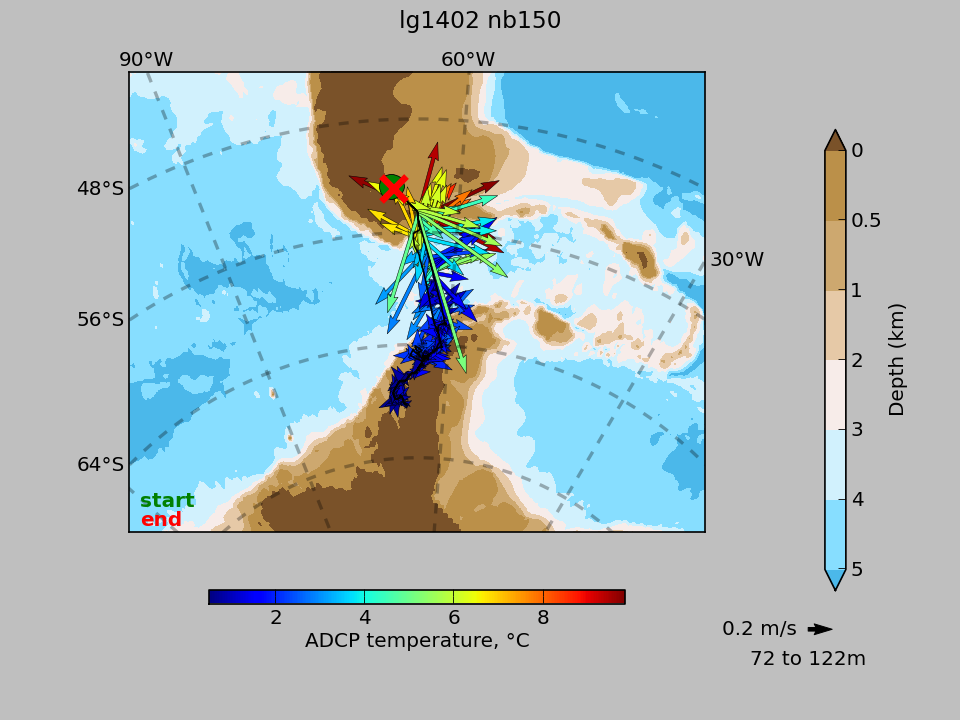
Collaborative Research: Submarine Groundwater and Freshwater Inputs Along the Western Antarctic Peninsula
Feb 2014 - Mar 2014
examine data
or download
png of map or (back to top)
or link to JASADCP
Palmer Station Turnover- winter staffing
Mar 2013 - Apr 2013
examine data
or download
png of map or (back to top)
or link to JASADCP

Palmer Station Turnover- winter staffing
Mar 2013 - Apr 2013
examine data
or download
png of map or (back to top)
or link to JASADCP

Microtubule Function, Protein Folding, and Embryogenesis in Antarctic Fishes: An Integrative Approach
Apr 2014 - May 2014
examine data
or download
png of map or (back to top)
or link to JASADCP
Microtubule Function, Protein Folding, and Embryogenesis in Antarctic Fishes: An Integrative Approach
Apr 2014 - May 2014
examine data
or download
png of map or (back to top)
or link to JASADCP

Environmental, organismal and evolutionary physiology of freeze avoidance in antarctic Notothenoid fishes
Jun 2014 - Aug 2014
examine data
or download
png of map or (back to top)
or link to JASADCP

Environmental, organismal and evolutionary physiology of freeze avoidance in antarctic Notothenoid fishes
Jun 2014 - Aug 2014
examine data
or download
png of map or (back to top)
or link to JASADCP
Palmer Station Opening
Sep 2014 - Sep 2014
examine data
or download
png of map or (back to top)
or link to JASADCP

Palmer Station Opening
Sep 2014 - Sep 2014
examine data
or download
png of map or (back to top)
or link to JASADCP
Palmer Station Science Opening
Sep 2014 - Sep 2014
examine data
or download
png of map or (back to top)
or link to JASADCP

Palmer Station Science Opening
Sep 2014 - Sep 2014
examine data
or download
png of map or (back to top)
or link to JASADCP
Study impact of local physical processes on Adelie peguin foraging ecology in the vicinity of Palmer Deep canyon off Anvers Island; WAP (Kohut) Analysis of acoutic Doppler current profilers records form 1999 to present
Oct 2014 - Nov 2014
examine data
or download
png of map or (back to top)
or link to JASADCP
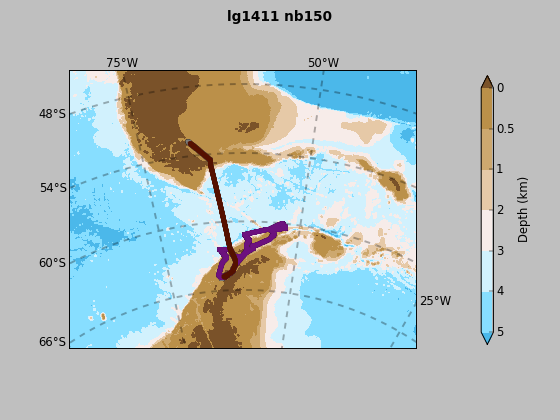
Continuously monitor the fronts in the southern Drake Passage by deploying and piloting a pair of ocean gliders to collect approx. 1000 profiles of temp, salinity, dissolved oxygen, fluorescence and optial backscatter
Nov 2014 - Dec 2014
examine data
or download
png of map or (back to top)
or link to JASADCP
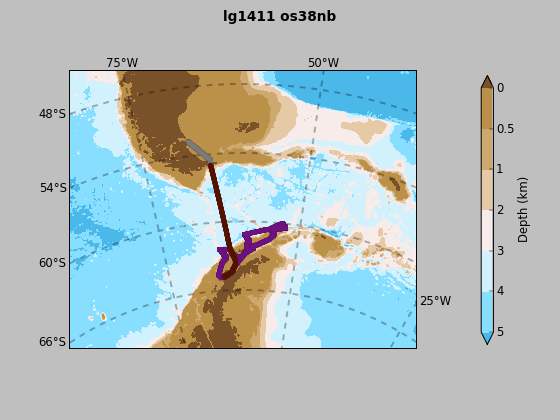
Continuously monitor the fronts in the southern Drake Passage by deploying and piloting a pair of ocean gliders to collect approx. 1000 profiles of temp, salinity, dissolved oxygen, fluorescence and optial backscatter
Nov 2014 - Dec 2014
examine data
or download
png of map or (back to top)
or link to JASADCP
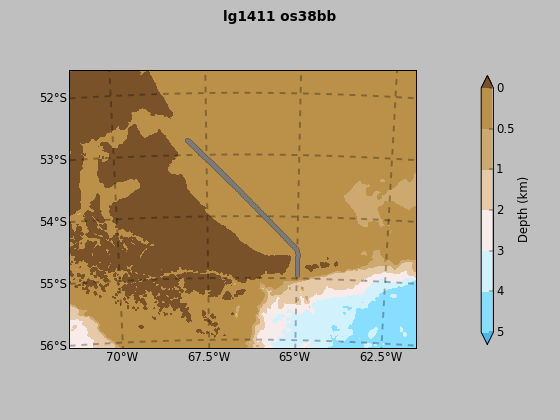
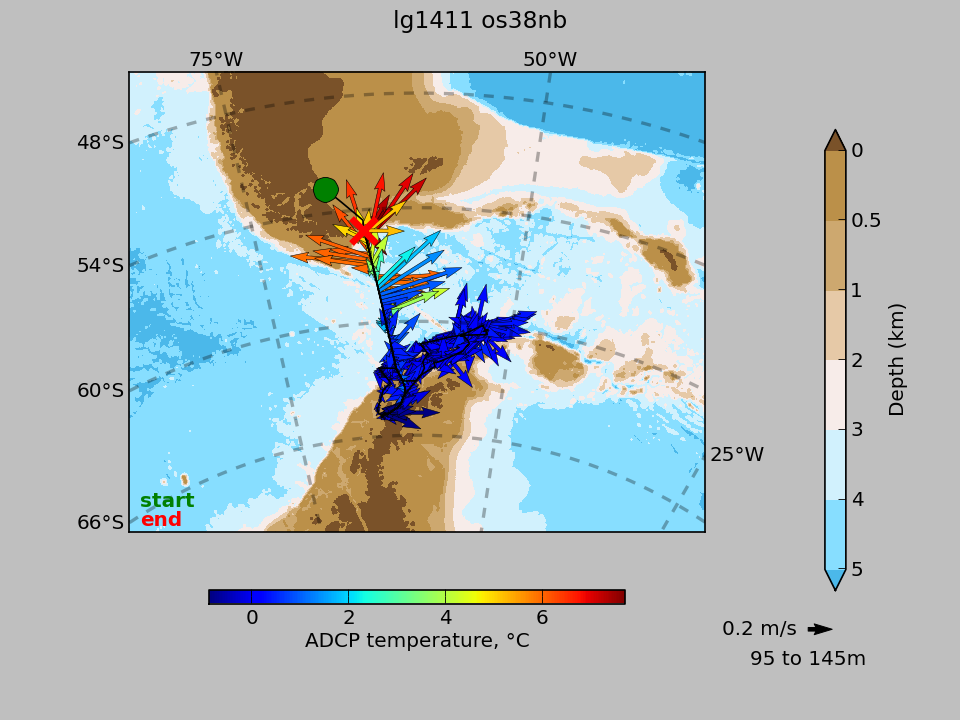