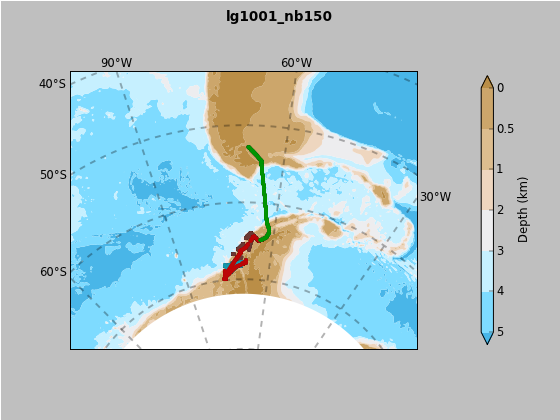
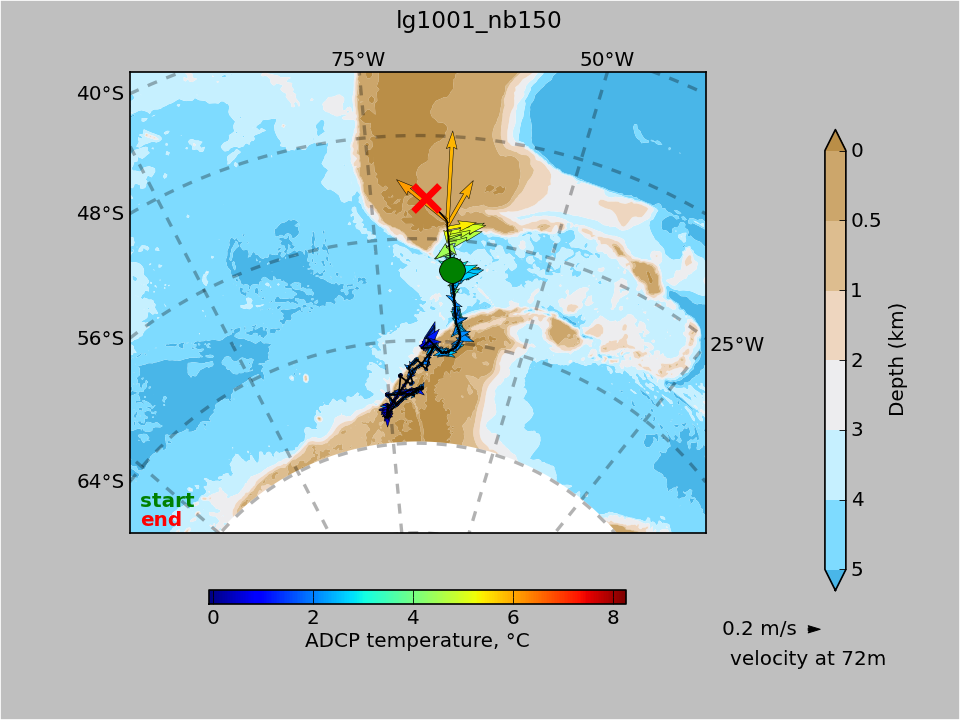
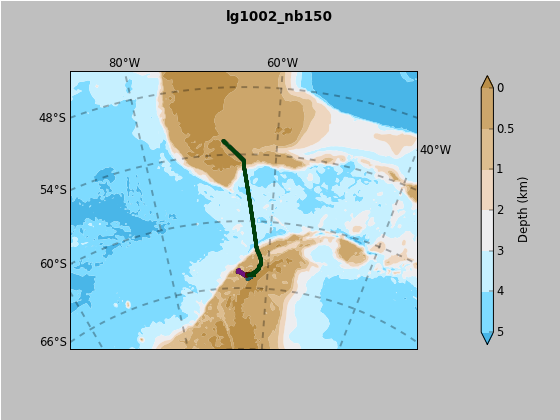
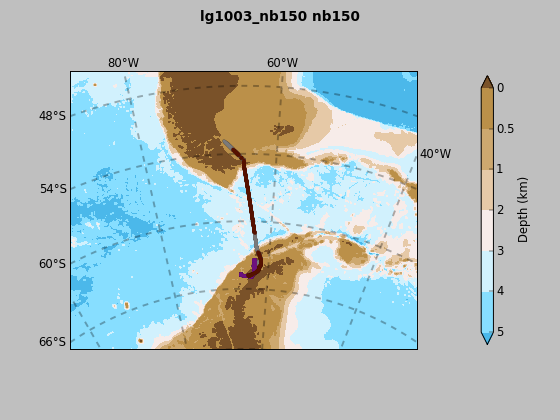
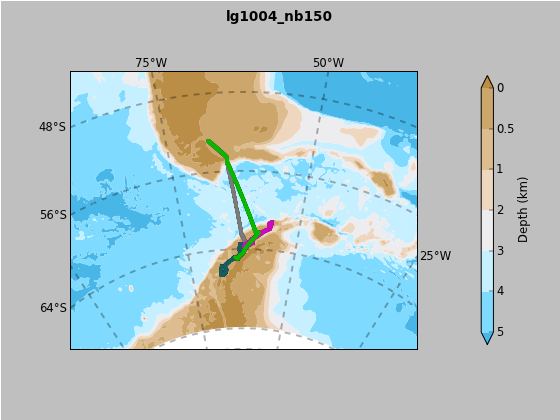
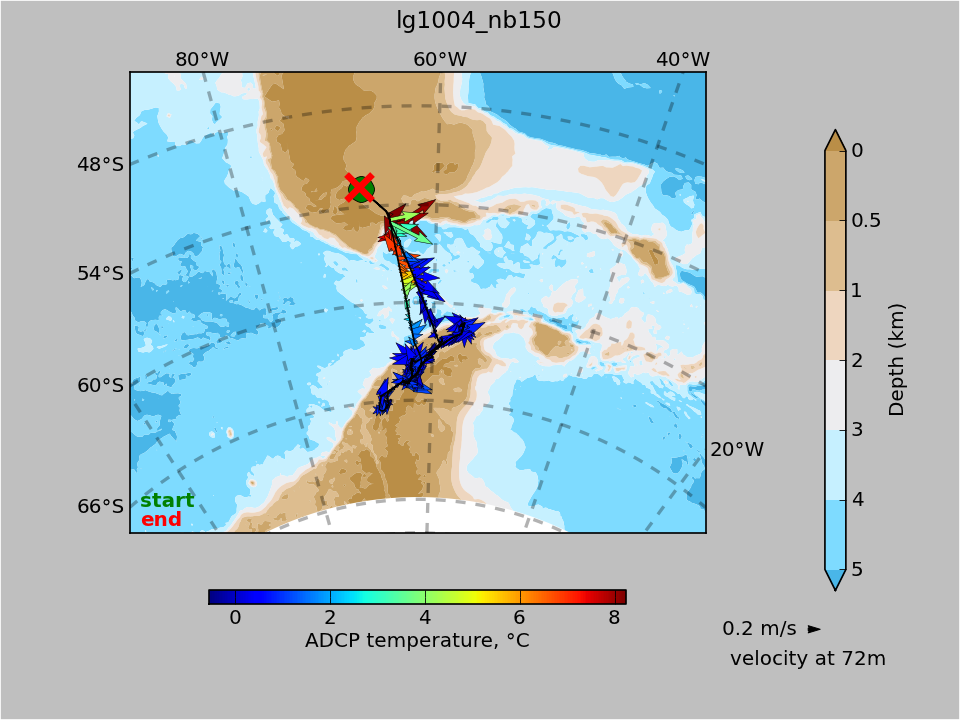
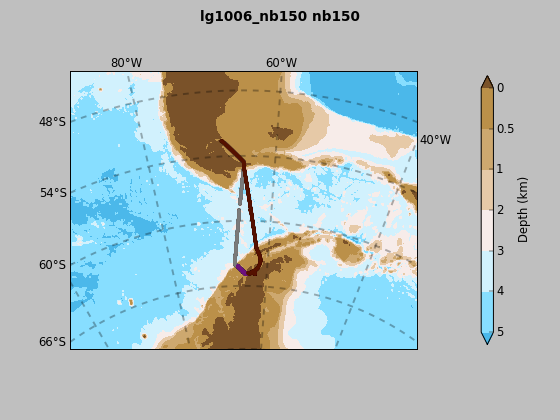
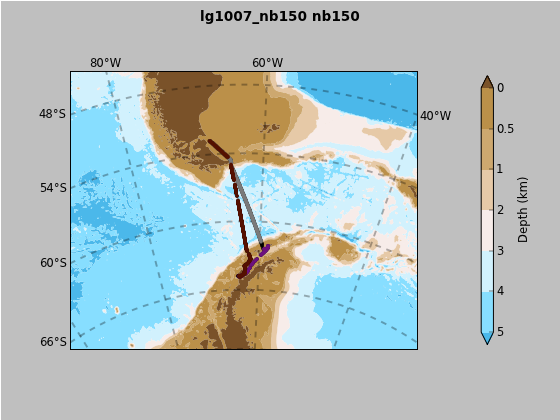
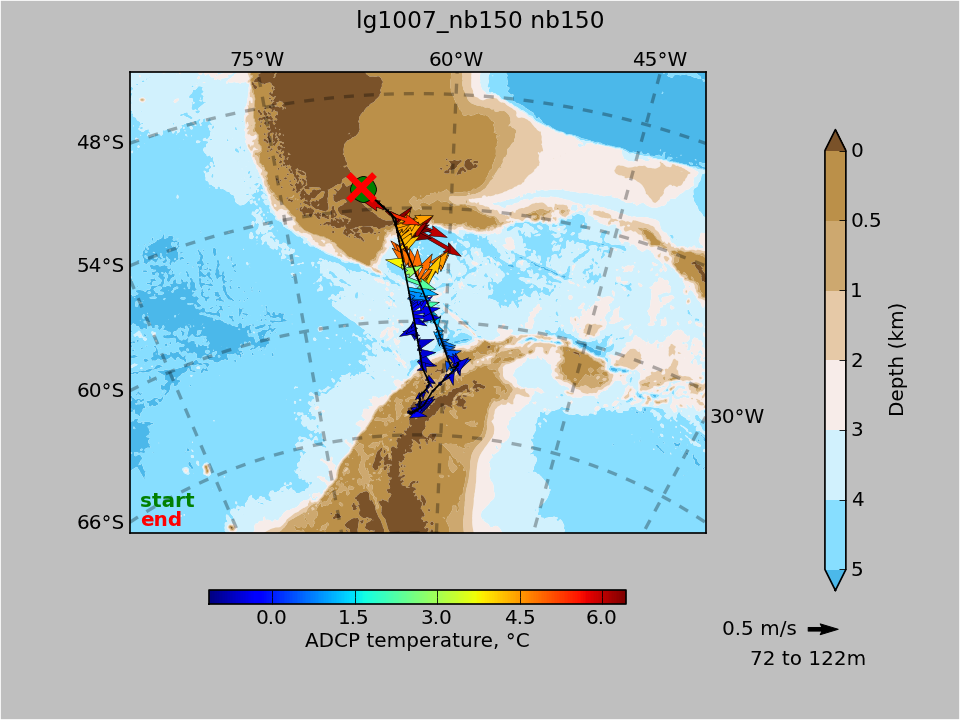
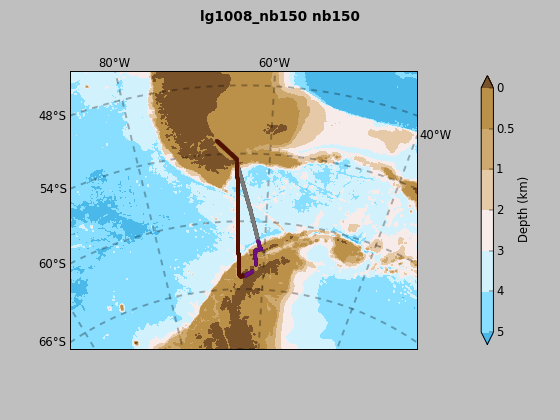
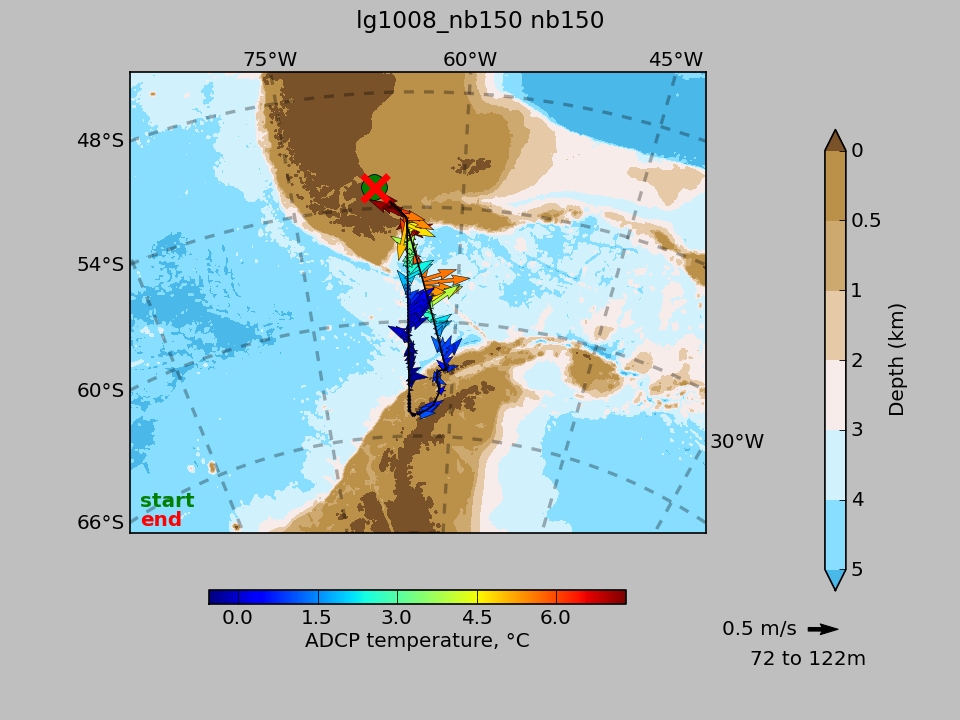
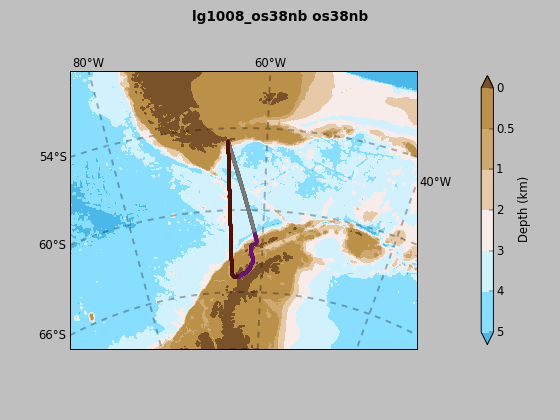
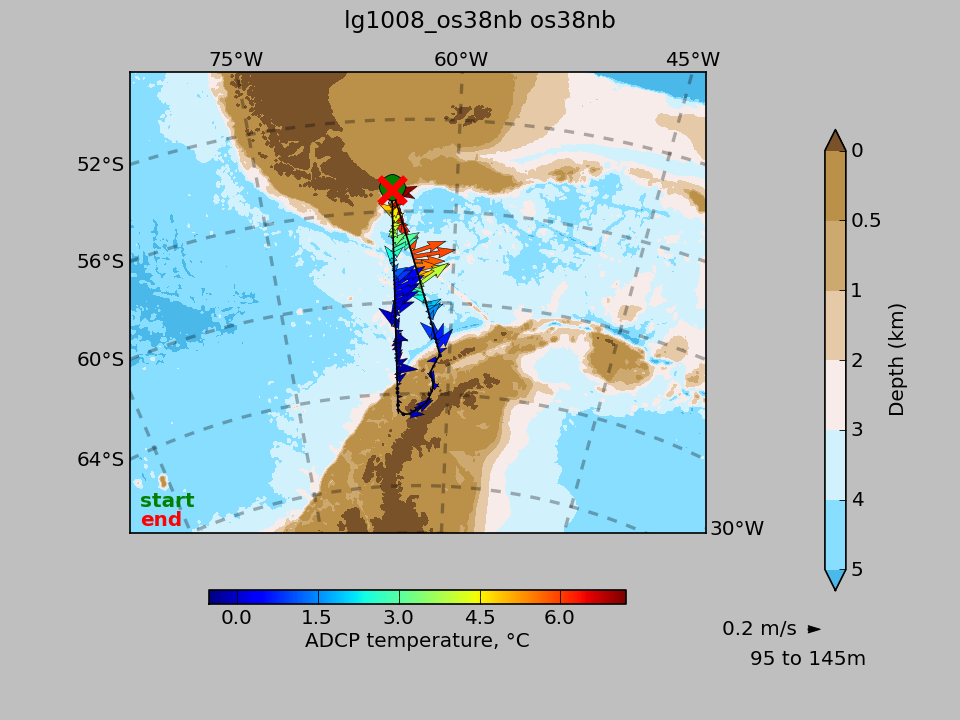
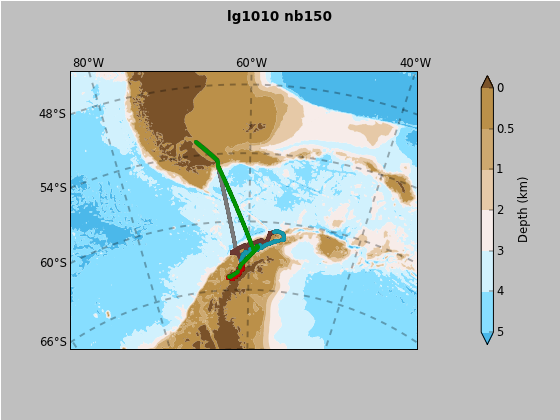
Long-Term Ecological Research on the Antarctic Marine Ecosystem: An Ice-Dominated Environment (LTER).
Dec 2009 - Feb, 2010
examine data
or download
png of map or (back to top)
or link to JASADCP
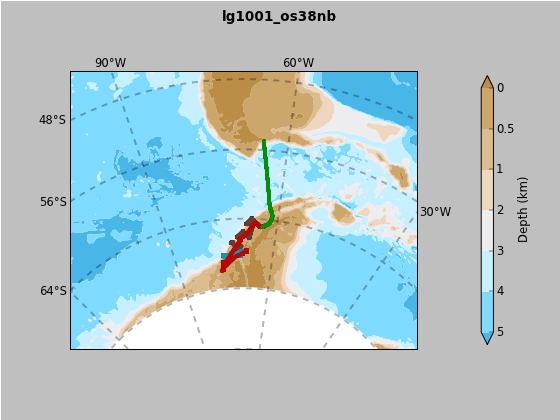
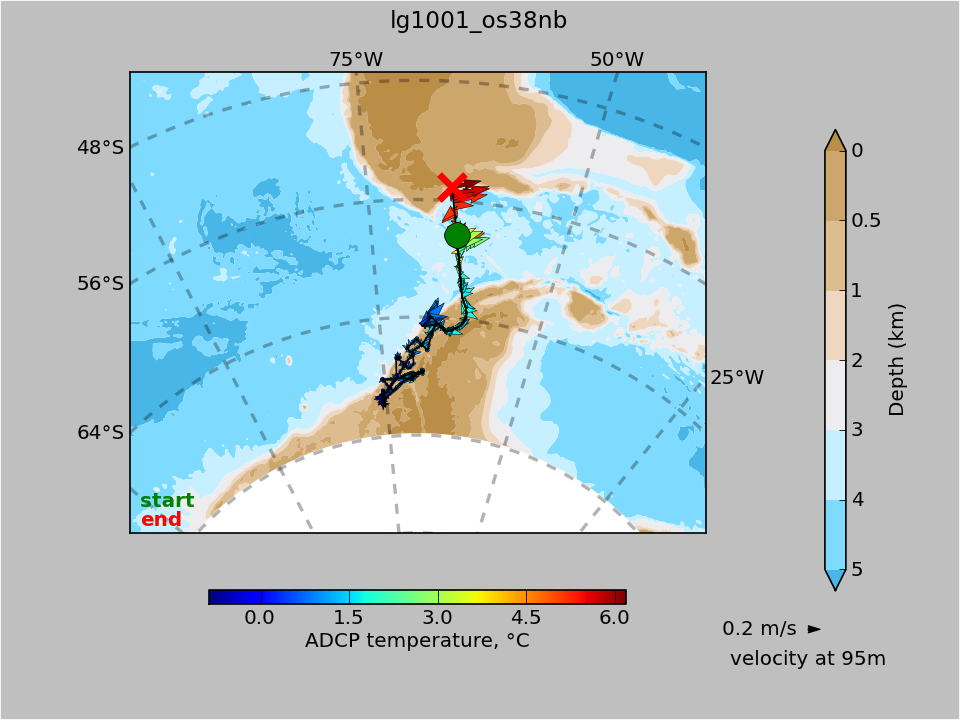
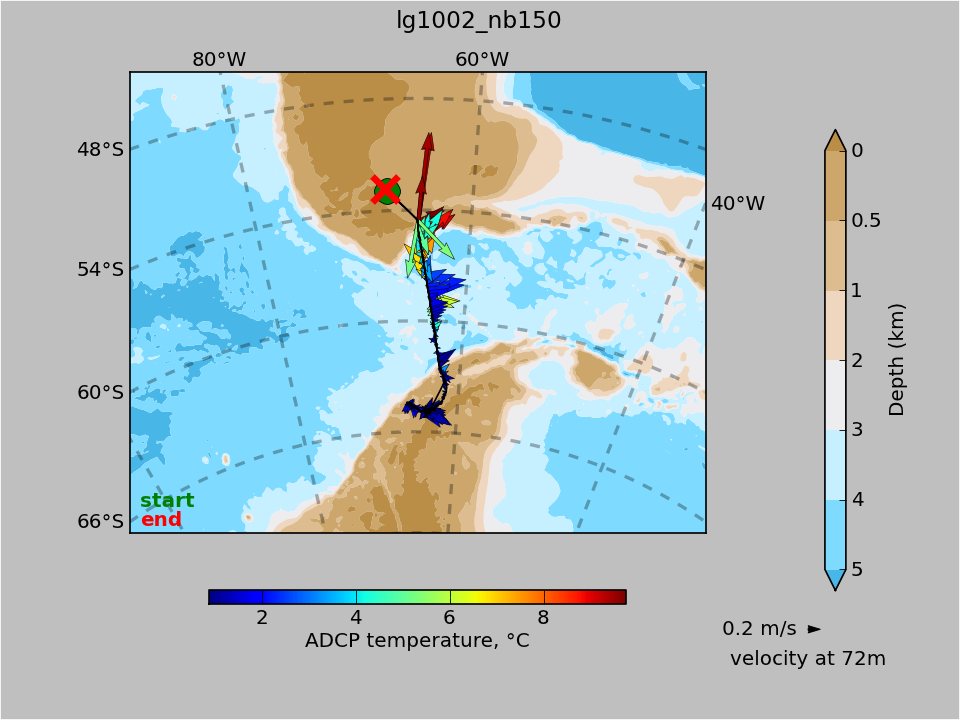
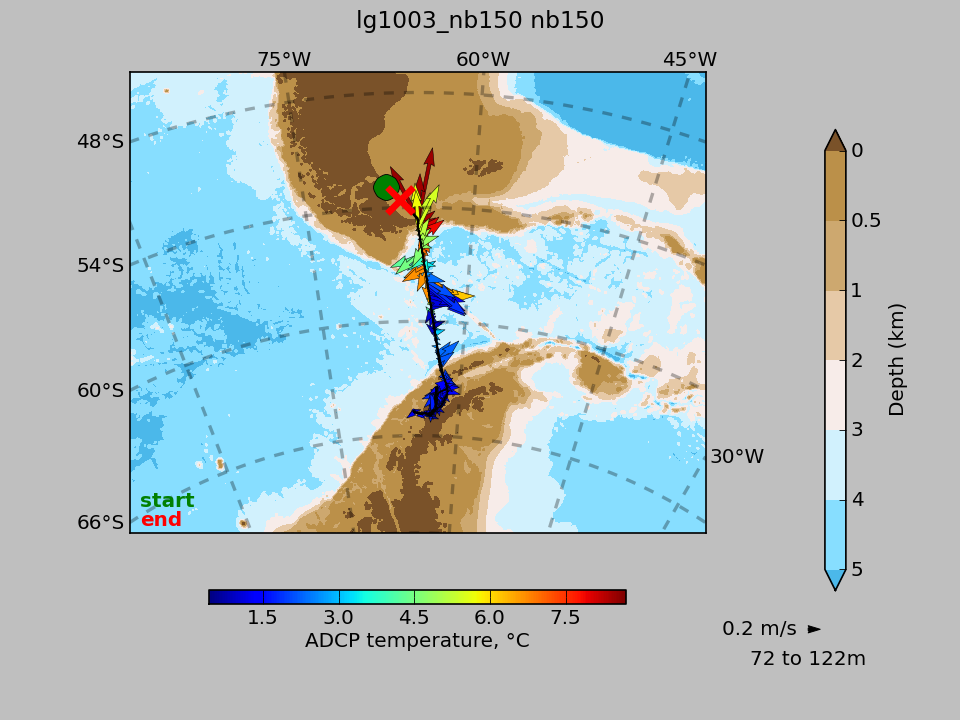
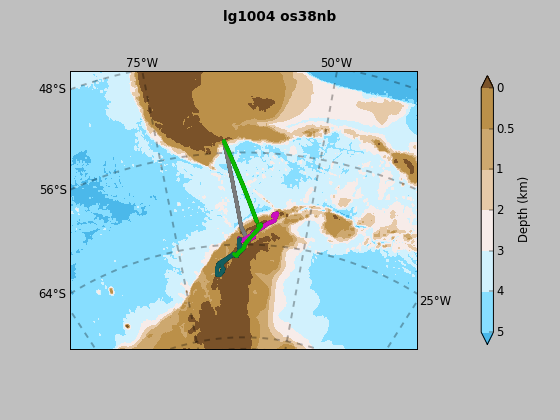
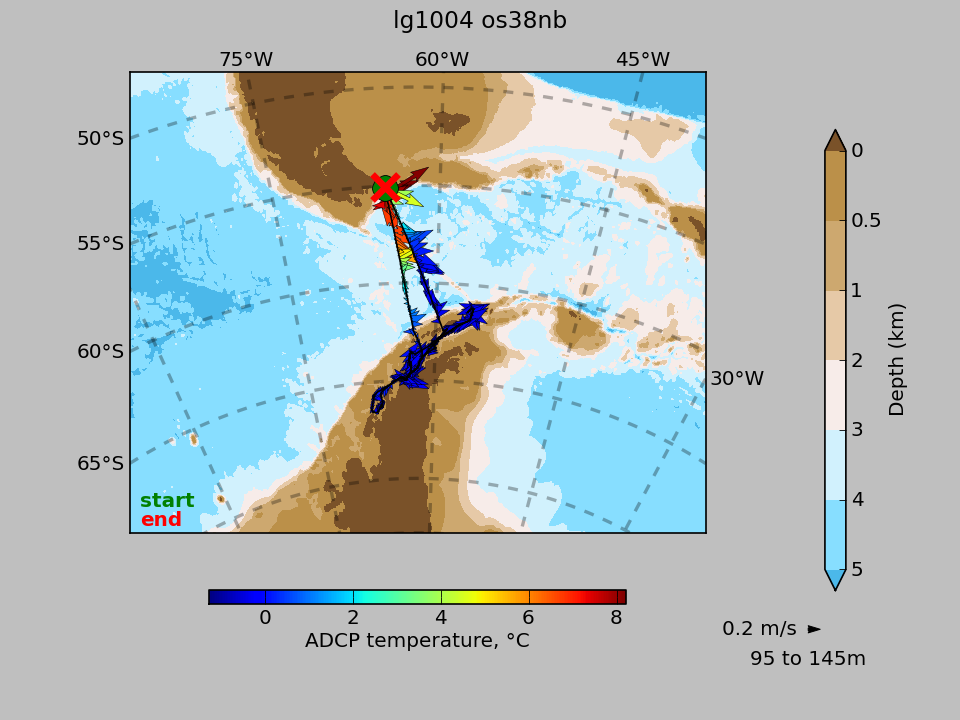
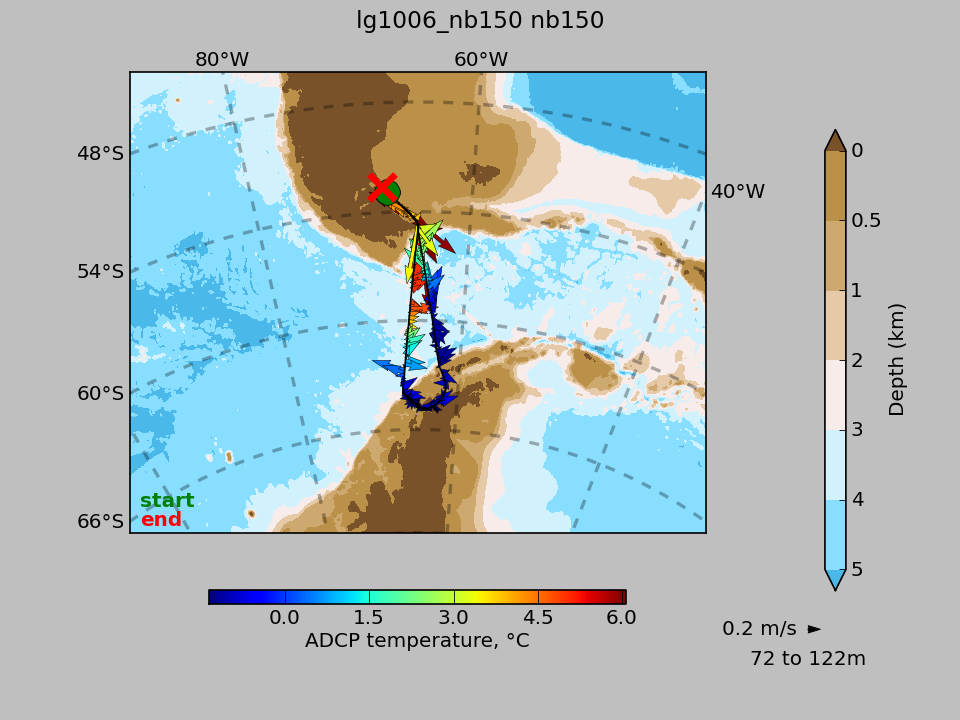
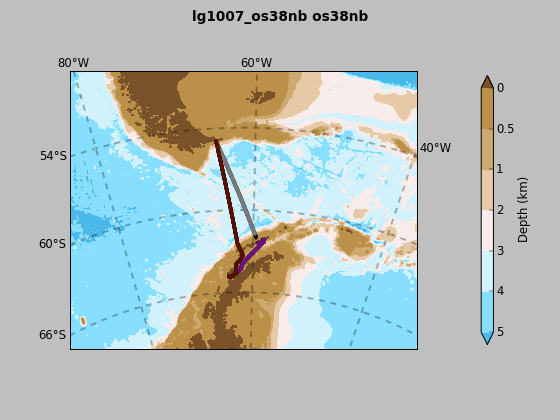
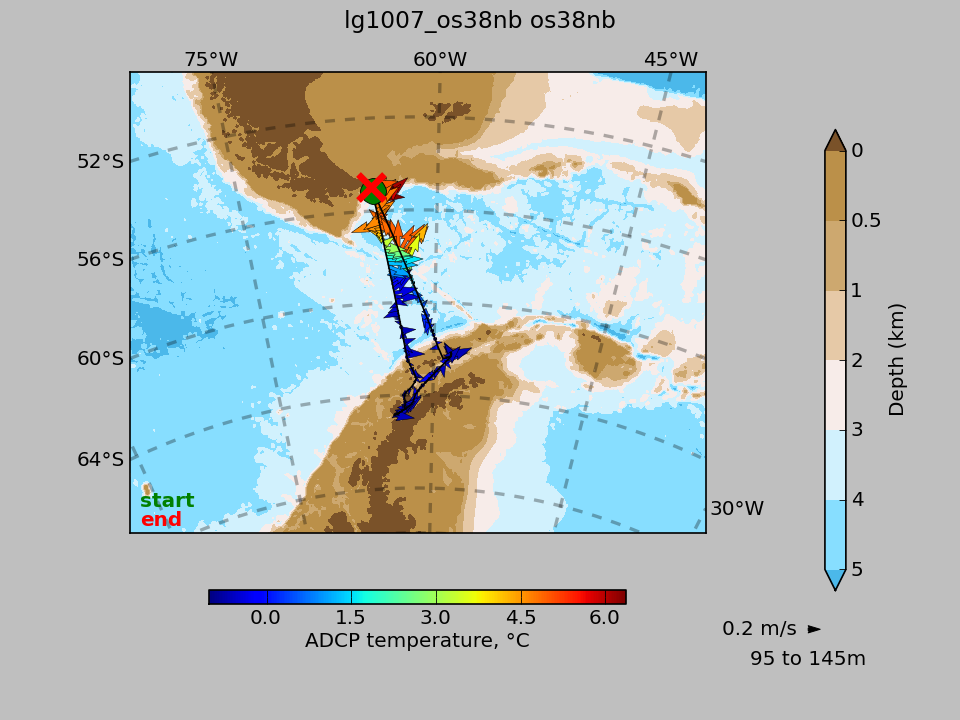
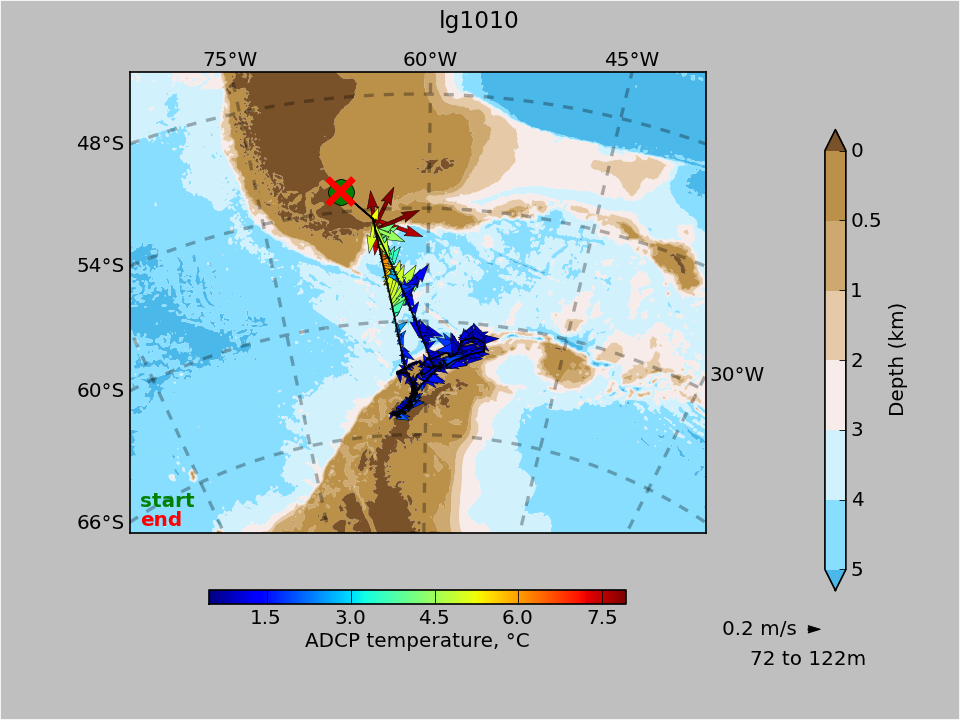
Long-Term Ecological Research on the Antarctic Marine Ecosystem: An Ice-Dominated Environment (LTER).
Dec 2009 - Feb, 2010
examine data
or download
png of map or (back to top)
or link to JASADCP
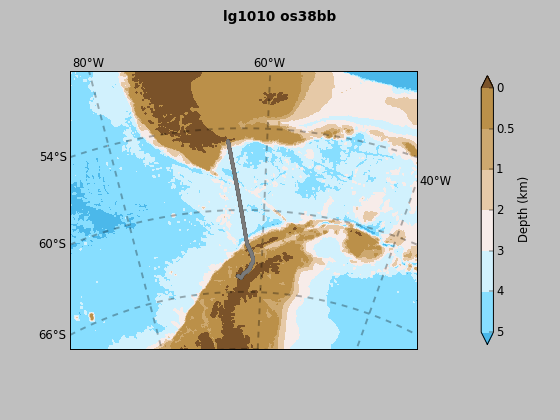
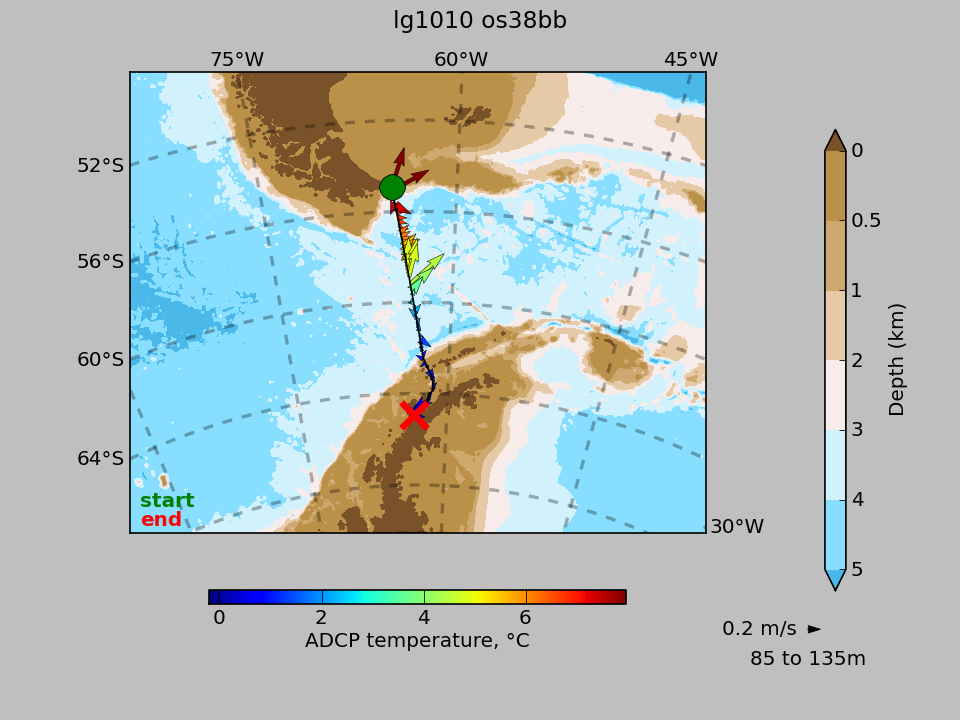
Palmer Station Logistics Support.
Feb 2010 - Mar, 2010
examine data
or download
png of map or (back to top)
or link to JASADCP
Palmer Station Logistics Support.
Feb 2010 - Mar, 2010
examine data
or download
png of map or (back to top)
or link to JASADCP
Protein folding and function at cold temperature: Co-evolution of the chaperonin CCT and tubulins from antarctic fishes.
Apr 2010 - Apr, 2010
examine data
or download
png of map or (back to top)
or link to JASADCP
Protein folding and function at cold temperature: Co-evolution of the chaperonin CCT and tubulins from antarctic fishes.
Apr 2010 - Apr, 2010
examine data
or download
png of map or (back to top)
or link to JASADCP
Protein folding and function at cold temperature: Co-evolution of the chaperonin CCT and tubulins from antarctic fishes.
Apr 2010 - Apr, 2010
examine data
or download
png of map or (back to top)
or link to JASADCP
Protein folding and function at cold temperature: Co-evolution of the chaperonin CCT and tubulins from antarctic fishes.
Apr 2010 - Apr, 2010
examine data
or download
png of map or (back to top)
or link to JASADCP
Ammonia Oxidation Versus Heterotrophy in Crenarchaeota Populations from Marine Environments West of the Antarctic Peninsula.
Sep 2010 - Sep, 2010
examine data
or download
png of map or (back to top)
or link to JASADCP
Ammonia Oxidation Versus Heterotrophy in Crenarchaeota Populations from Marine Environments West of the Antarctic Peninsula.
Sep 2010 - Sep, 2010
examine data
or download
png of map or (back to top)
or link to JASADCP
COPA Opening. Palmer Station Opening
Oct 2010 - Oct, 2010
examine data
or download
png of map or (back to top)
or link to JASADCP
COPA Opening. Palmer Station Opening
Oct 2010 - Oct, 2010
examine data
or download
png of map or (back to top)
or link to JASADCP
Cape Shirreff Opening
Oct 2010 - Nov, 2010
examine data
or download
png of map or (back to top)
or link to JASADCP
Cape Shirreff Opening
Oct 2010 - Nov, 2010
examine data
or download
png of map or (back to top)
or link to JASADCP
Acoustic Assessment of Southern Ocean Salps and Their Ecosystem Impact
Nov 2010 - Dec, 2010
examine data
or download
png of map or (back to top)
or link to JASADCP
Acoustic Assessment of Southern Ocean Salps and Their Ecosystem Impact
Nov 2010 - Dec, 2010
examine data
or download
png of map or (back to top)
or link to JASADCP
Acoustic Assessment of Southern Ocean Salps and Their Ecosystem Impact
Nov 2010 - Dec, 2010
examine data
or download
png of map or (back to top)
or link to JASADCP